Figure 3
Download original image
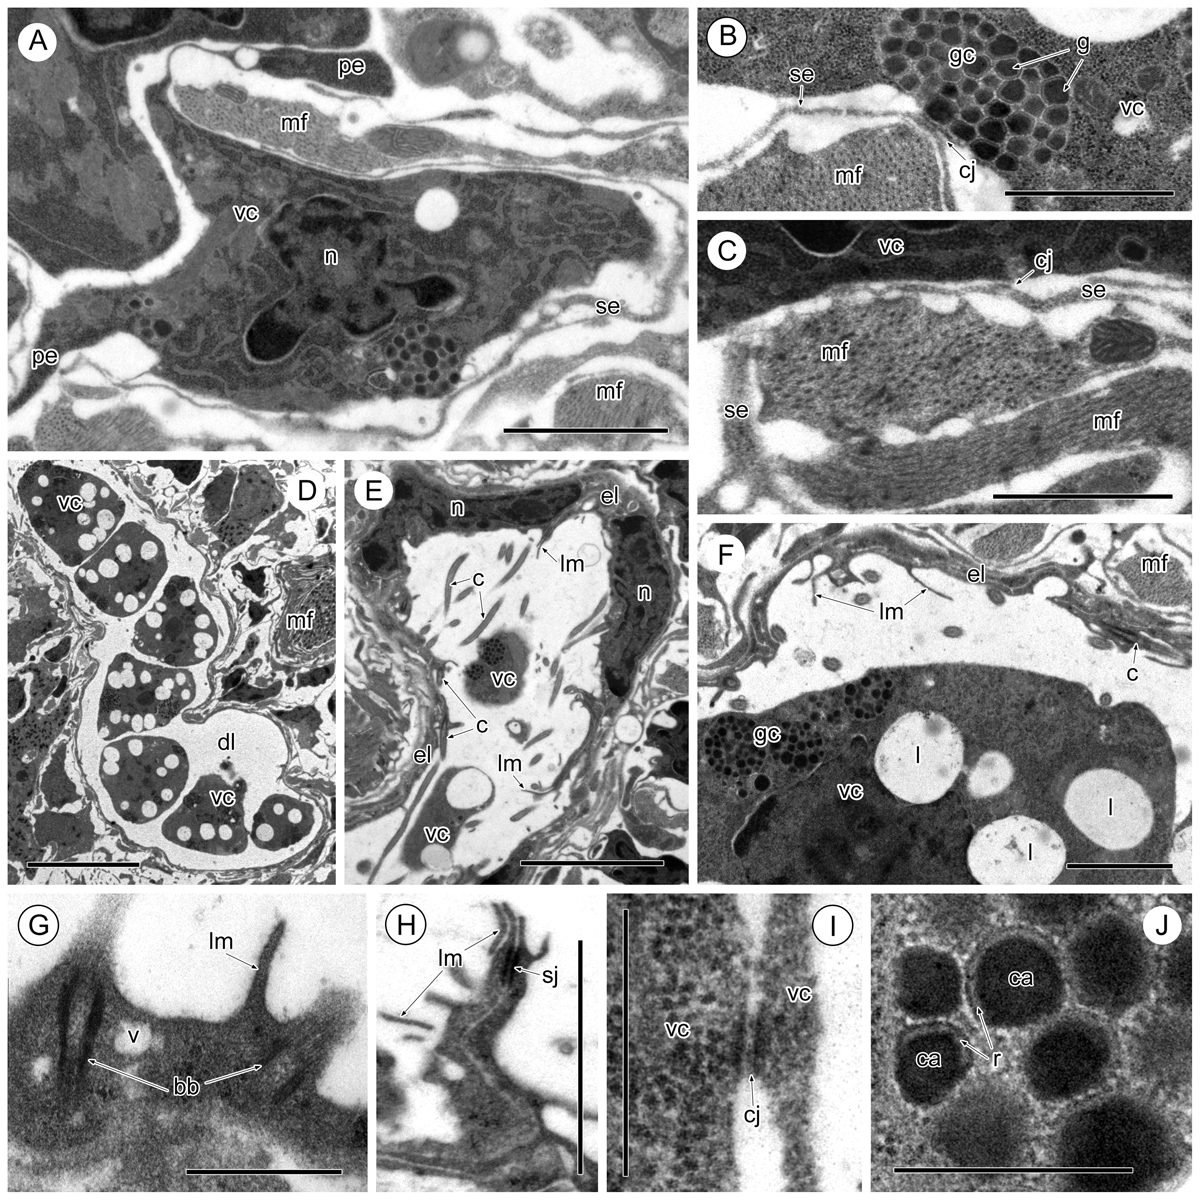
Vitelline cells (A–C, I, J) and vitelline duct (D–H) of Sanguinicola sp. 2 from ides. (A) Vitelline cell showing the various shapes of the cytoplasmic extensions, note the presence of numerous muscle fibres around this cell. Scale bar = 2 μm. (B) Intercellular junction between a vitelline cell and the thin, sarcoplasmic extension of a muscle cell. Scale bar = 1 μm. (C) Cell junction between a vitelline cell and a sarcoplasmic extension. Scale bar = 1 μm. (D) Part of the vitelline duct filled with mature vitelline cells. Scale bar = 10 μm. (E, F) Flattened, ciliated, epithelial lining of the vitelline duct showing the inter-epithelial nuclei of these cells. Scale bars = 5 μm (E) and 2 μm (F). (G) Region of the epithelial lining of the vitelline duct showing basal ciliary bodies and a short surface lamella. Scale bar = 0.5 μm. (H) Apical septate junction in the duct epithelium. Scale bar = 0.5 μm. (I) Intercellular junction between two vitelline cells. Scale bar = 0.5 μm. (J) Heterogeneous vitelline globules. Scale bar = 0.2 μm. Abbreviations: bb = basal body of cilium, c = cilium, ca = central area of vitelline globule, cj = cell junction, dl = vitelline duct lumen, el = epithelial lining of vitelline duct, g = vitelline globule; gc = globular cluster, l = lipid droplet, lm = lamella, mf = muscle fibres, n = nucleus, pe = pseudopodium-like extension, r = lucid rim of vitelline globule, se = sarcoplasmic extension, sj = septate junction, v = vesicle, vc = vitelline cell.
Current usage metrics show cumulative count of Article Views (full-text article views including HTML views, PDF and ePub downloads, according to the available data) and Abstracts Views on Vision4Press platform.
Data correspond to usage on the plateform after 2015. The current usage metrics is available 48-96 hours after online publication and is updated daily on week days.
Initial download of the metrics may take a while.