Figure 2
Download original image
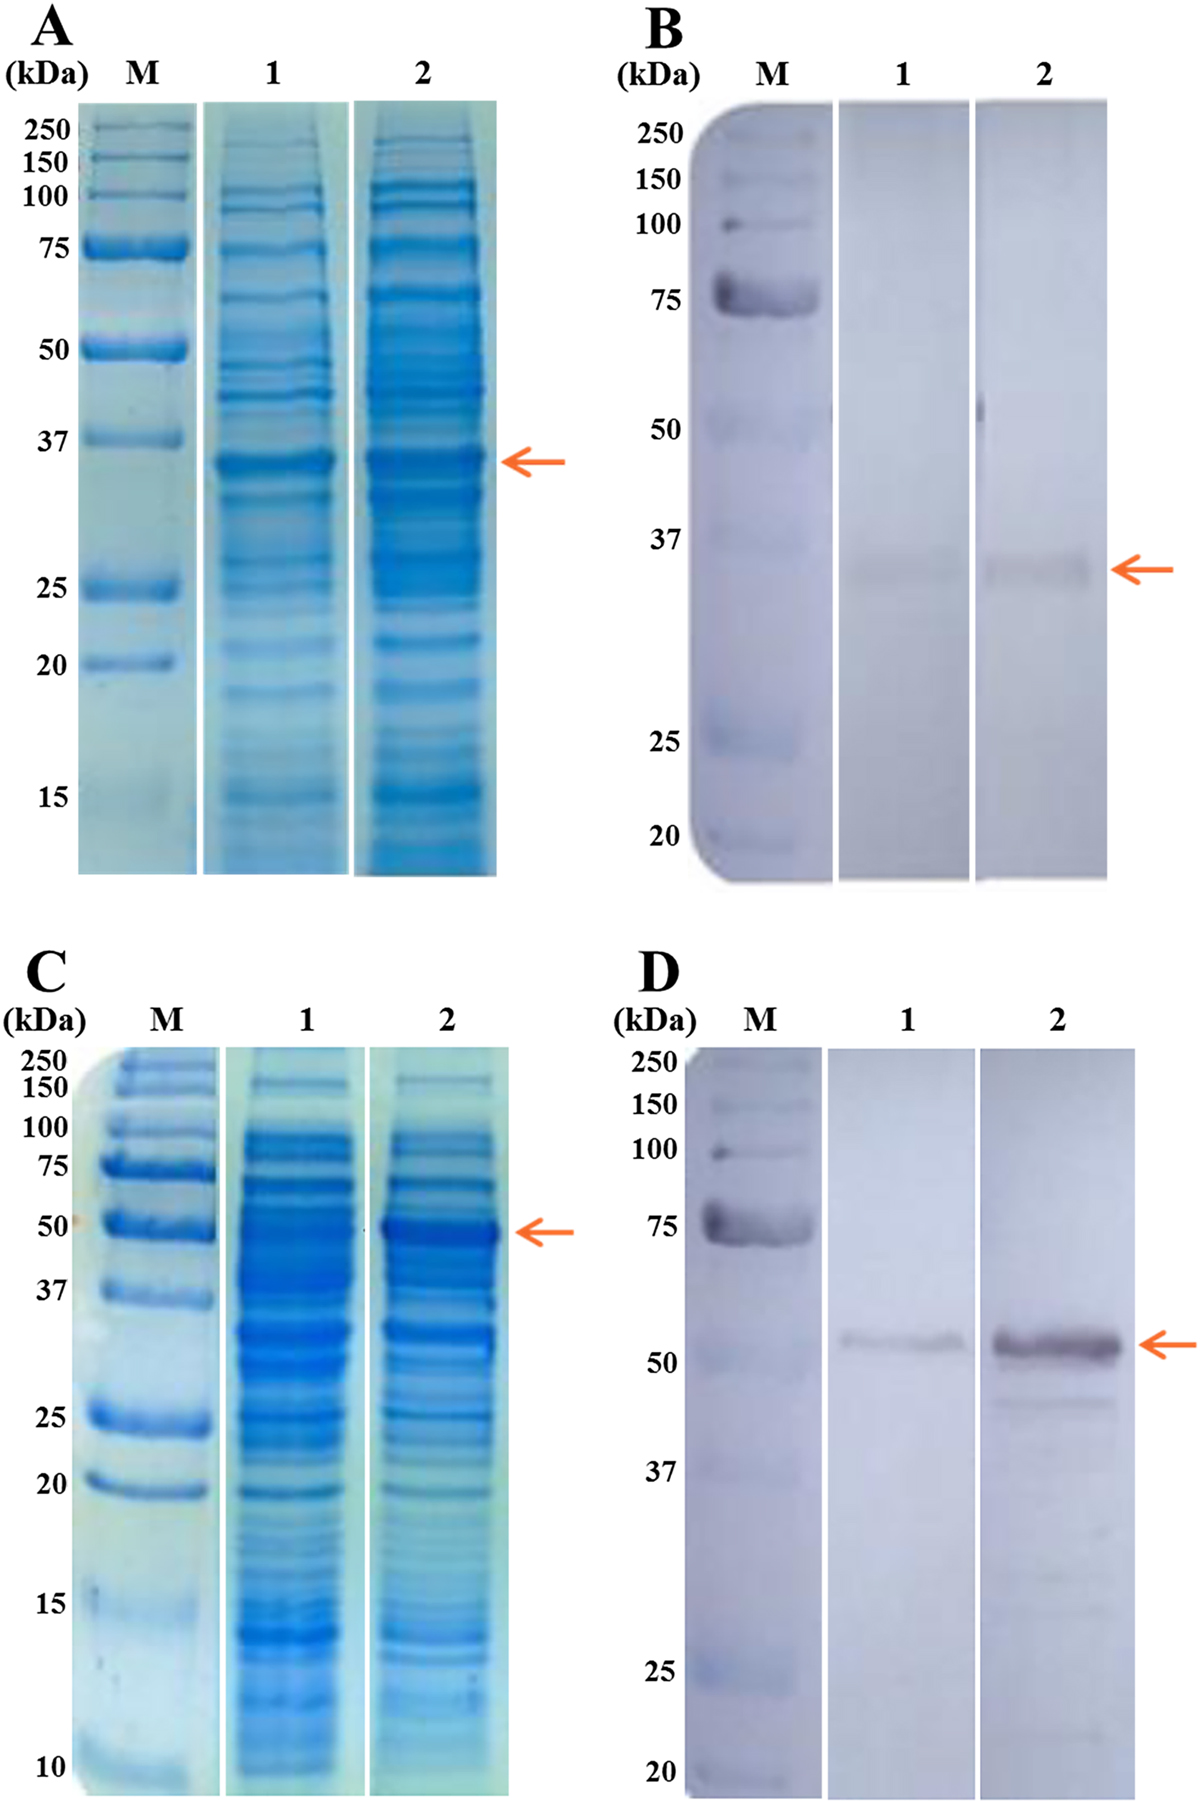
Recombinant proteins expression. A. SDS-PAGE analysis of protein fractions from E. coli cultures for rGluCl expression. M = Molecular weight marker. 1 = Uninduced and 2 = Induced culture with IPTG. B. Western blot analysis of rGluCl. M = Molecular weight marker. 1 = Uninduced and 2 = Induced culture with IPTG. C. SDS-PAGE analysis of protein fractions from E. coli cultures for rGlyR expression. M = Molecular weight marker. 1 = Uninduced and 2 = Induced culture with IPTG. D. Western blot analysis of rGlyR. M = Molecular weight marker. 1 = Uninduced and 2 = Induced culture with IPTG. In all cases, the molecular weight marker used was the Precision Plus Protein All Blue Prestained Protein Standard from Bio-Rad. Arrows indicate the size of the recombinant proteins.
Current usage metrics show cumulative count of Article Views (full-text article views including HTML views, PDF and ePub downloads, according to the available data) and Abstracts Views on Vision4Press platform.
Data correspond to usage on the plateform after 2015. The current usage metrics is available 48-96 hours after online publication and is updated daily on week days.
Initial download of the metrics may take a while.