Figure 2
Download original image
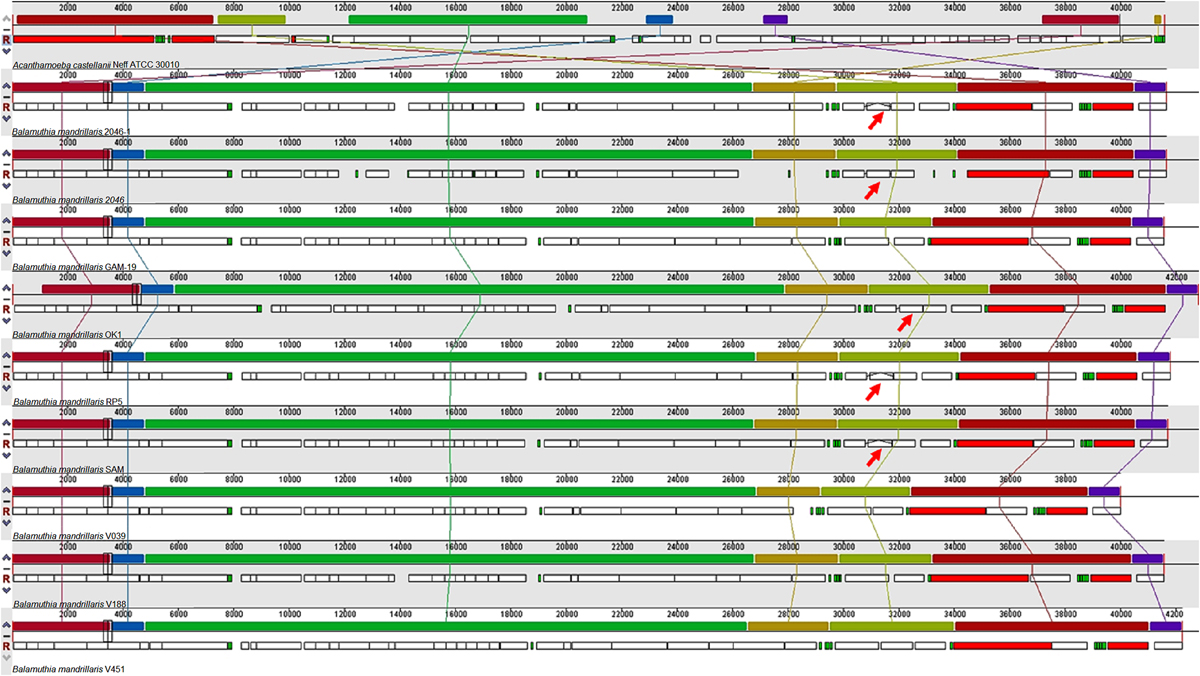
Alignment of B. mandrillaris mitochondrial genomes (mtDNA), using A. castellanii mtDNA as a reference. The lines show the synteny between the genomes. The upper rectangles show the locally collinear blocks and the lower boxes the annotated genes: red (rRNA), green (tRNA), and white CDS (coding sequence). Red arrows indicate the presence of the LAGLIDADG sequence disrupting the cox1 gene.
Current usage metrics show cumulative count of Article Views (full-text article views including HTML views, PDF and ePub downloads, according to the available data) and Abstracts Views on Vision4Press platform.
Data correspond to usage on the plateform after 2015. The current usage metrics is available 48-96 hours after online publication and is updated daily on week days.
Initial download of the metrics may take a while.