Figure 10
Download original image
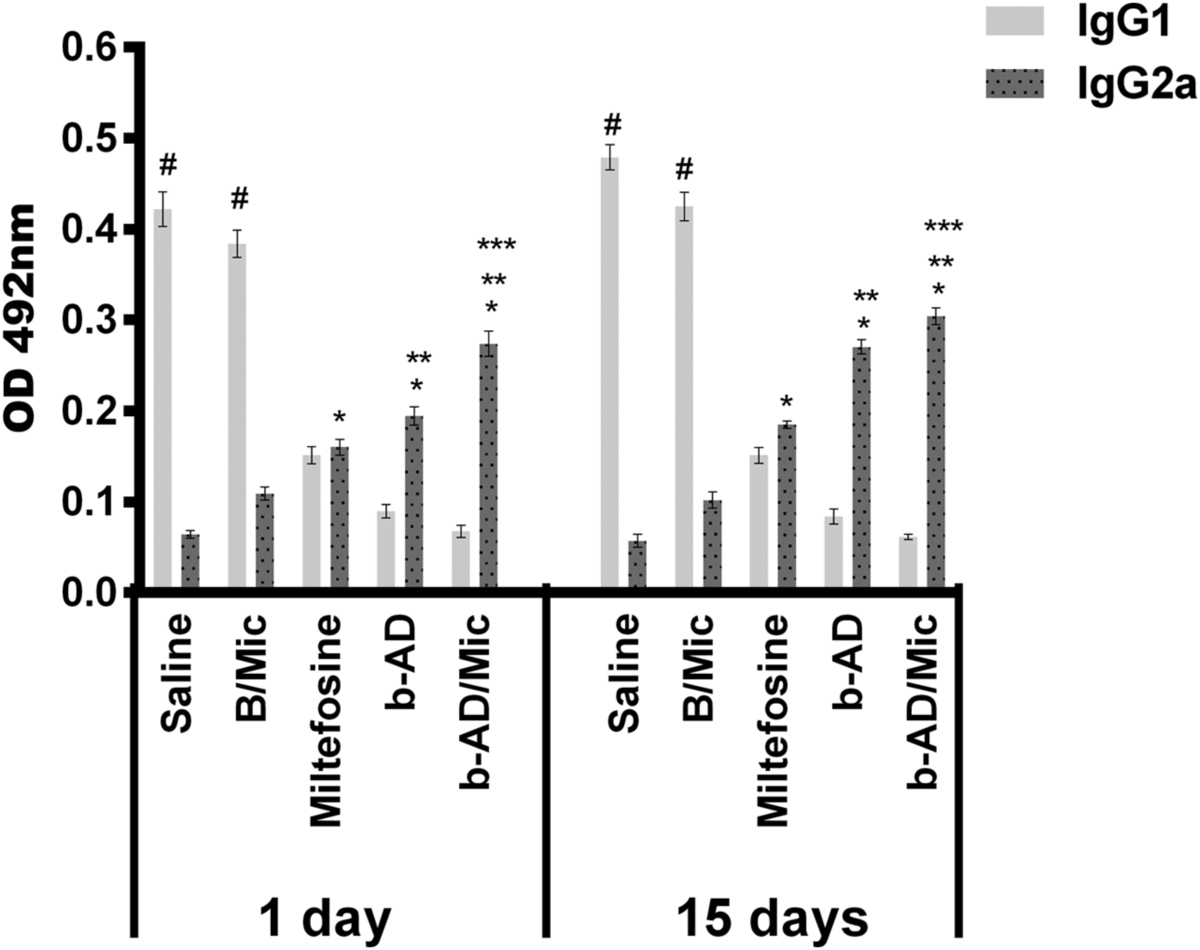
Antibody response produced in the treated animals. Serum samples were collected of mice infected and later treated, 1 and 15 days post-therapy, and levels of anti-parasite IgG1 and IgG2a isotypes were investigated by ELISA. Bars represent the mean ± standard deviation of the groups. (*) indicates a significant difference as compared to the saline and B/Mic groups (p < 0.05). (**) indicates a statistically significant difference as compared to the miltefosine group (p < 0.05). (***) indicates a statistically significant difference as compared to the b-AD group (p < 0.05). (#) indicates a statistically significant difference as compared to the miltefosine, b-AD and b-AD/Mic groups (p < 0.05).
Current usage metrics show cumulative count of Article Views (full-text article views including HTML views, PDF and ePub downloads, according to the available data) and Abstracts Views on Vision4Press platform.
Data correspond to usage on the plateform after 2015. The current usage metrics is available 48-96 hours after online publication and is updated daily on week days.
Initial download of the metrics may take a while.