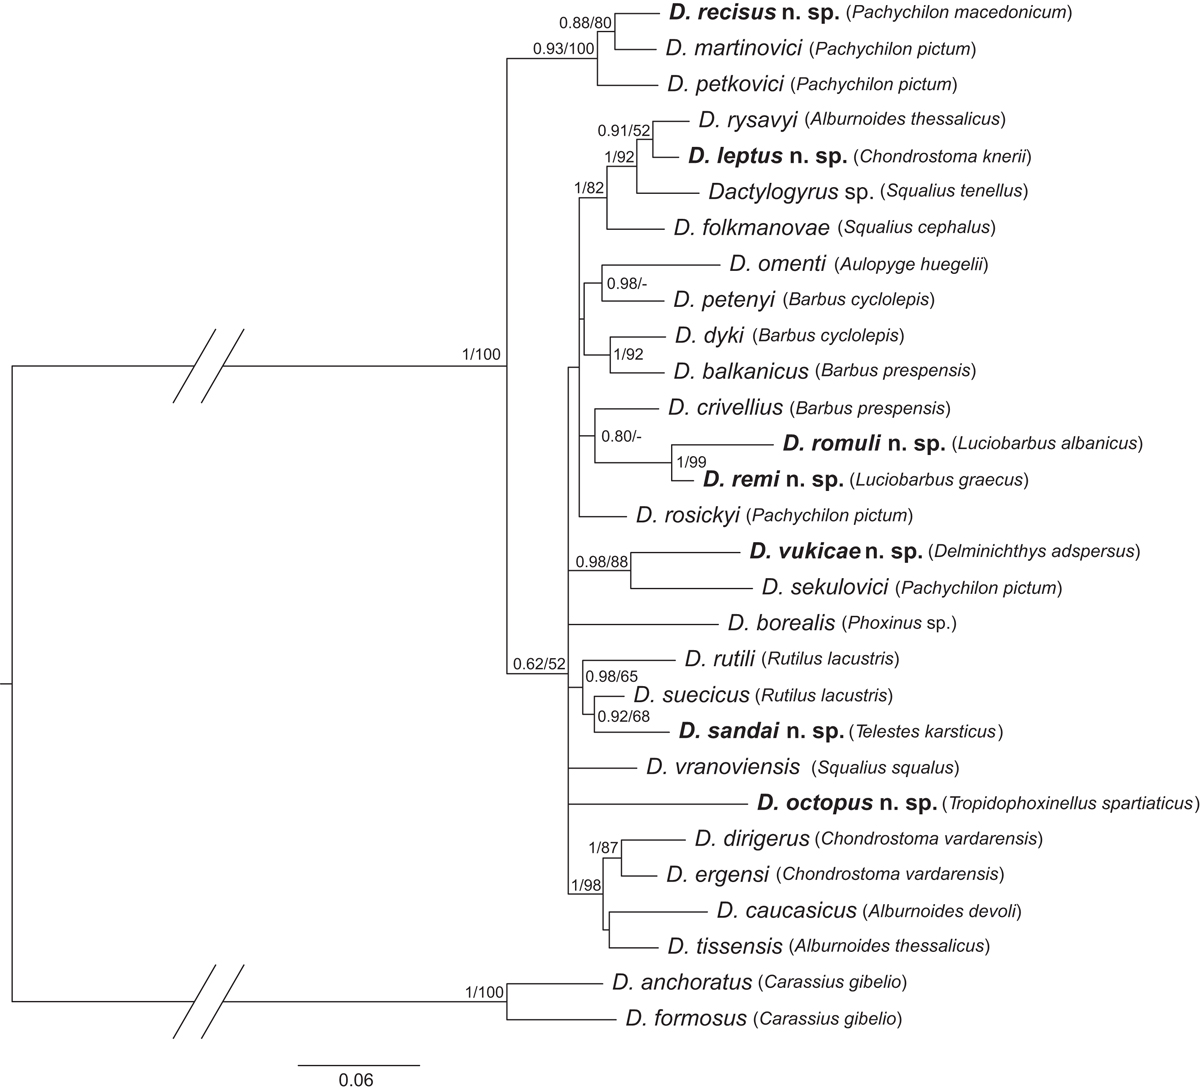
Figure 14
Download original image
Phylogenetic tree of 29 Dactylogyrus species (hosts in brackets) constructed by Bayesian Inference (BI). The tree is based on the combined DNA sequences of partial genes coding 18S rRNA, 5.8S rDNA, 28S rRNA and the entire ITS1 region. Values along branches indicate posterior probabilities and bootstrap values for each node resulting from Bayesian Inference and Maximum likelihood (ML) analyses, respectively. Values <0.80 for BI and <50% for ML are indicated by dashes.
Current usage metrics show cumulative count of Article Views (full-text article views including HTML views, PDF and ePub downloads, according to the available data) and Abstracts Views on Vision4Press platform.
Data correspond to usage on the plateform after 2015. The current usage metrics is available 48-96 hours after online publication and is updated daily on week days.
Initial download of the metrics may take a while.