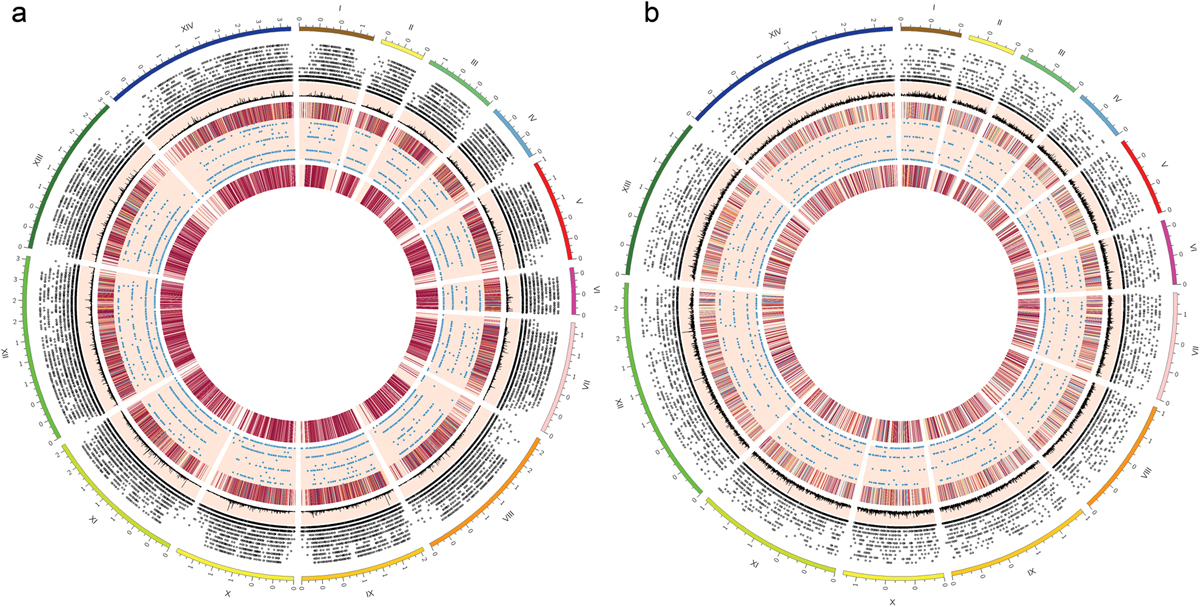
Figure 6
Download original image
Genome-wide representation of microsatellite distribution map for Plasmodium malariae UG01 and P. ovale curtisi GH01. Different features indicated by microsatellite distribution map for (a) P. malariae UG01 and (b) P. ovale curtisi GH01 from outermosta to innermost ring can be interpreted as: chromosome 1–14 (I–XIV), scatter plotbb for genomic microsatellite distribution based on unit motif length which corresponds to the height of spot from base of its ring, line plot with peaks indicating regions with long repeat length, heatmapc corresponding to the aggregate genomic microsatellite, scatter plot for microsatellites present in protein-coding region, heatmap for the aggregate microsatellites presenting in protein coding region of the genome. aEach unit difference in outermost ring represents chromosomal length of 1 mega base pair. b,cSpots and regions in scatter plot and heatmap may appear overlapped due to high density but are physically apart in sequence.
Current usage metrics show cumulative count of Article Views (full-text article views including HTML views, PDF and ePub downloads, according to the available data) and Abstracts Views on Vision4Press platform.
Data correspond to usage on the plateform after 2015. The current usage metrics is available 48-96 hours after online publication and is updated daily on week days.
Initial download of the metrics may take a while.