Figure 6
Download original image
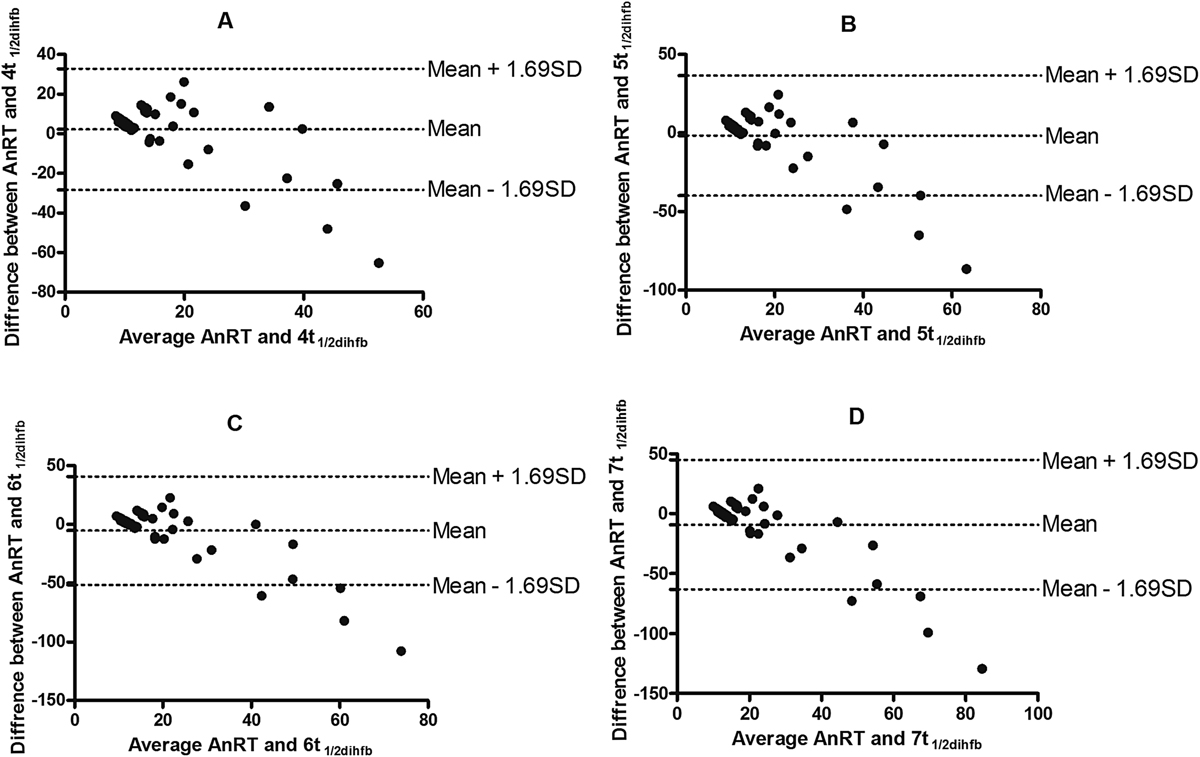
Bland-Altman plots of anaemia recovery time (AnRT) and multiples [4 (A), 5 (B), 6 (C) and 7 (D)] of half-time of deficit in haematocrit from baseline in children with persistent early-appearing anaemia. Biases were 2.23, −1.57, −5.37 and −9.17 for plots A, B, C and D; p = 0.29, 0.55, 0.09 and 0.02, respectively. The mean values ± 1.96 standard deviation (SD) of the differences are shown. dihfb, deficit in haematocrit from baseline.
Current usage metrics show cumulative count of Article Views (full-text article views including HTML views, PDF and ePub downloads, according to the available data) and Abstracts Views on Vision4Press platform.
Data correspond to usage on the plateform after 2015. The current usage metrics is available 48-96 hours after online publication and is updated daily on week days.
Initial download of the metrics may take a while.