Figure 4
Download original image
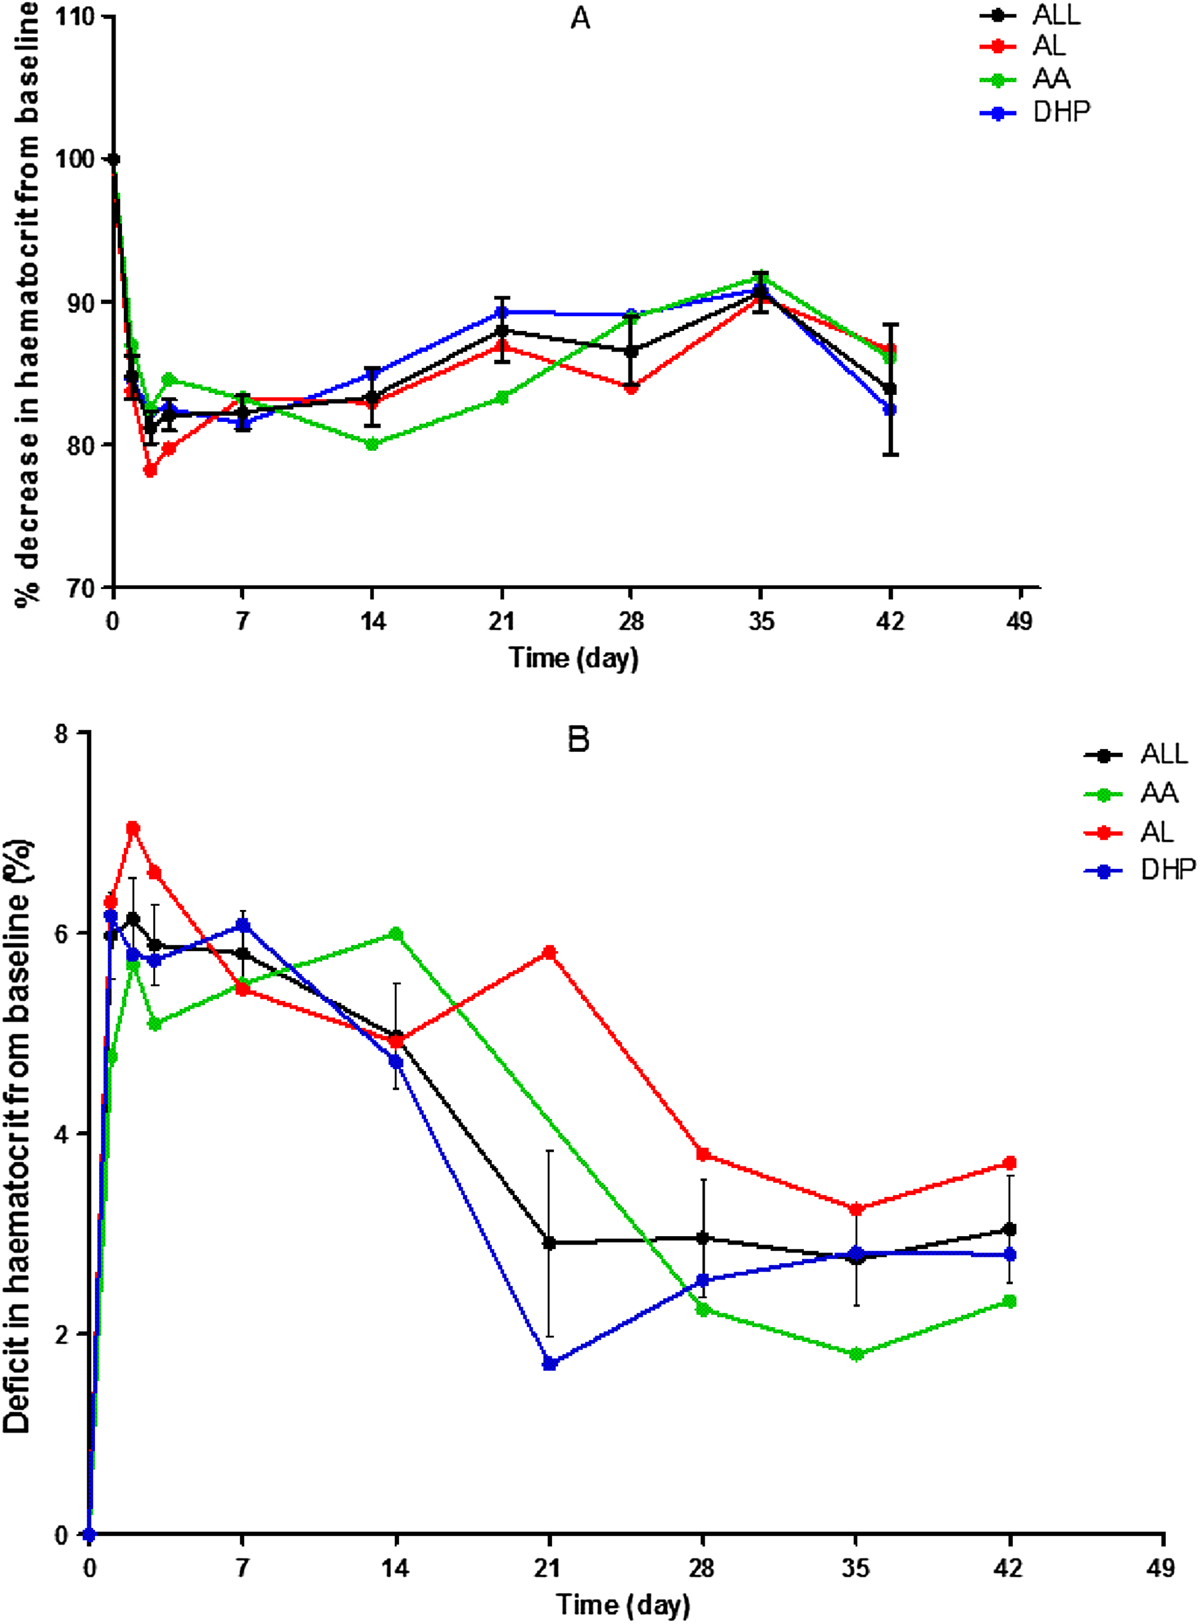
Time-course of percentage decrease (A) and of deficit in haematocrit (B) from baseline in all children (black line) and in those treated with artesunate-amodiaquine (green line), artemether-lumefantrine (red line) or dihydroartemisinin-piperaquine (blue line). Values are means and standard errors of mean; measures of dispersion have been included only in black plots for clarity.
Current usage metrics show cumulative count of Article Views (full-text article views including HTML views, PDF and ePub downloads, according to the available data) and Abstracts Views on Vision4Press platform.
Data correspond to usage on the plateform after 2015. The current usage metrics is available 48-96 hours after online publication and is updated daily on week days.
Initial download of the metrics may take a while.