Figure 1

Download original image
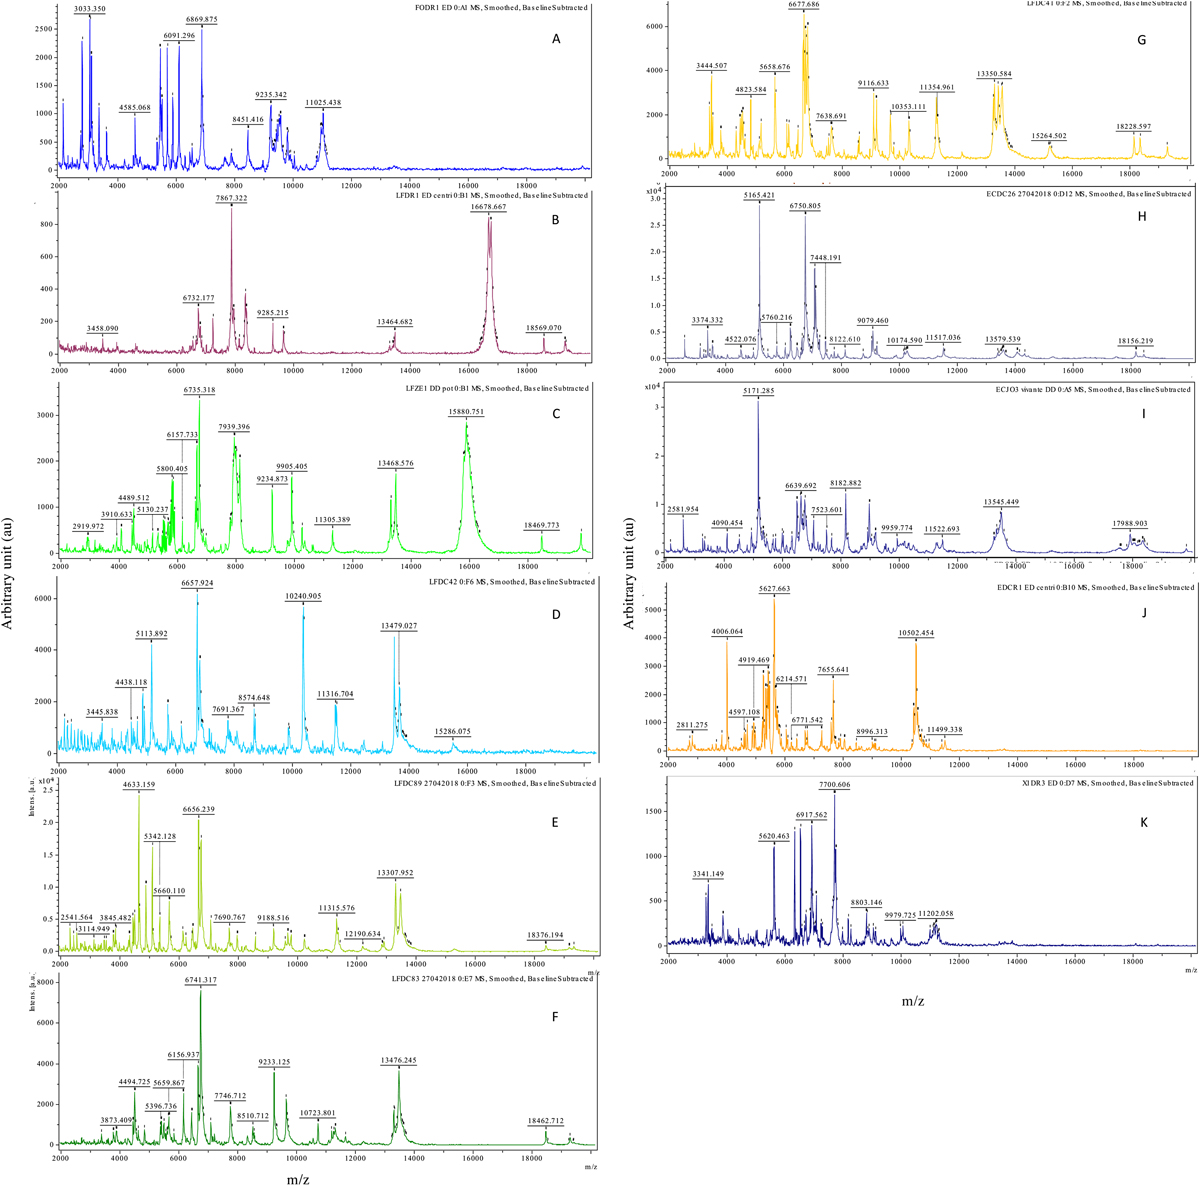
Representative MALDI-TOF spectra of cercariae obtained using a simple direct-deposit protocol. Flex Analysis software, smoothed spectra with baseline substracted A: Trichobilharzia anseri (FODR1) B: Diplostomum pseudospathaceum (LFDR1) C: Tylodelphys sp. (LFZE1) D: Australapatemon sp. (LFDC42) E: Cotylurus sp. (LFDC89) F: Posthodiplostomum sp. (LFDC83) G: Alaria alata (LFDC 41) H: Echinoparyphium sp. (ECDC26) I: Echinostoma revolutum (ECJO3) J: Petasiger phalacrocoracis (ECDR1) K: Plagiorchis sp. (XIDR3)
Current usage metrics show cumulative count of Article Views (full-text article views including HTML views, PDF and ePub downloads, according to the available data) and Abstracts Views on Vision4Press platform.
Data correspond to usage on the plateform after 2015. The current usage metrics is available 48-96 hours after online publication and is updated daily on week days.
Initial download of the metrics may take a while.


