Figure 1
Download original image
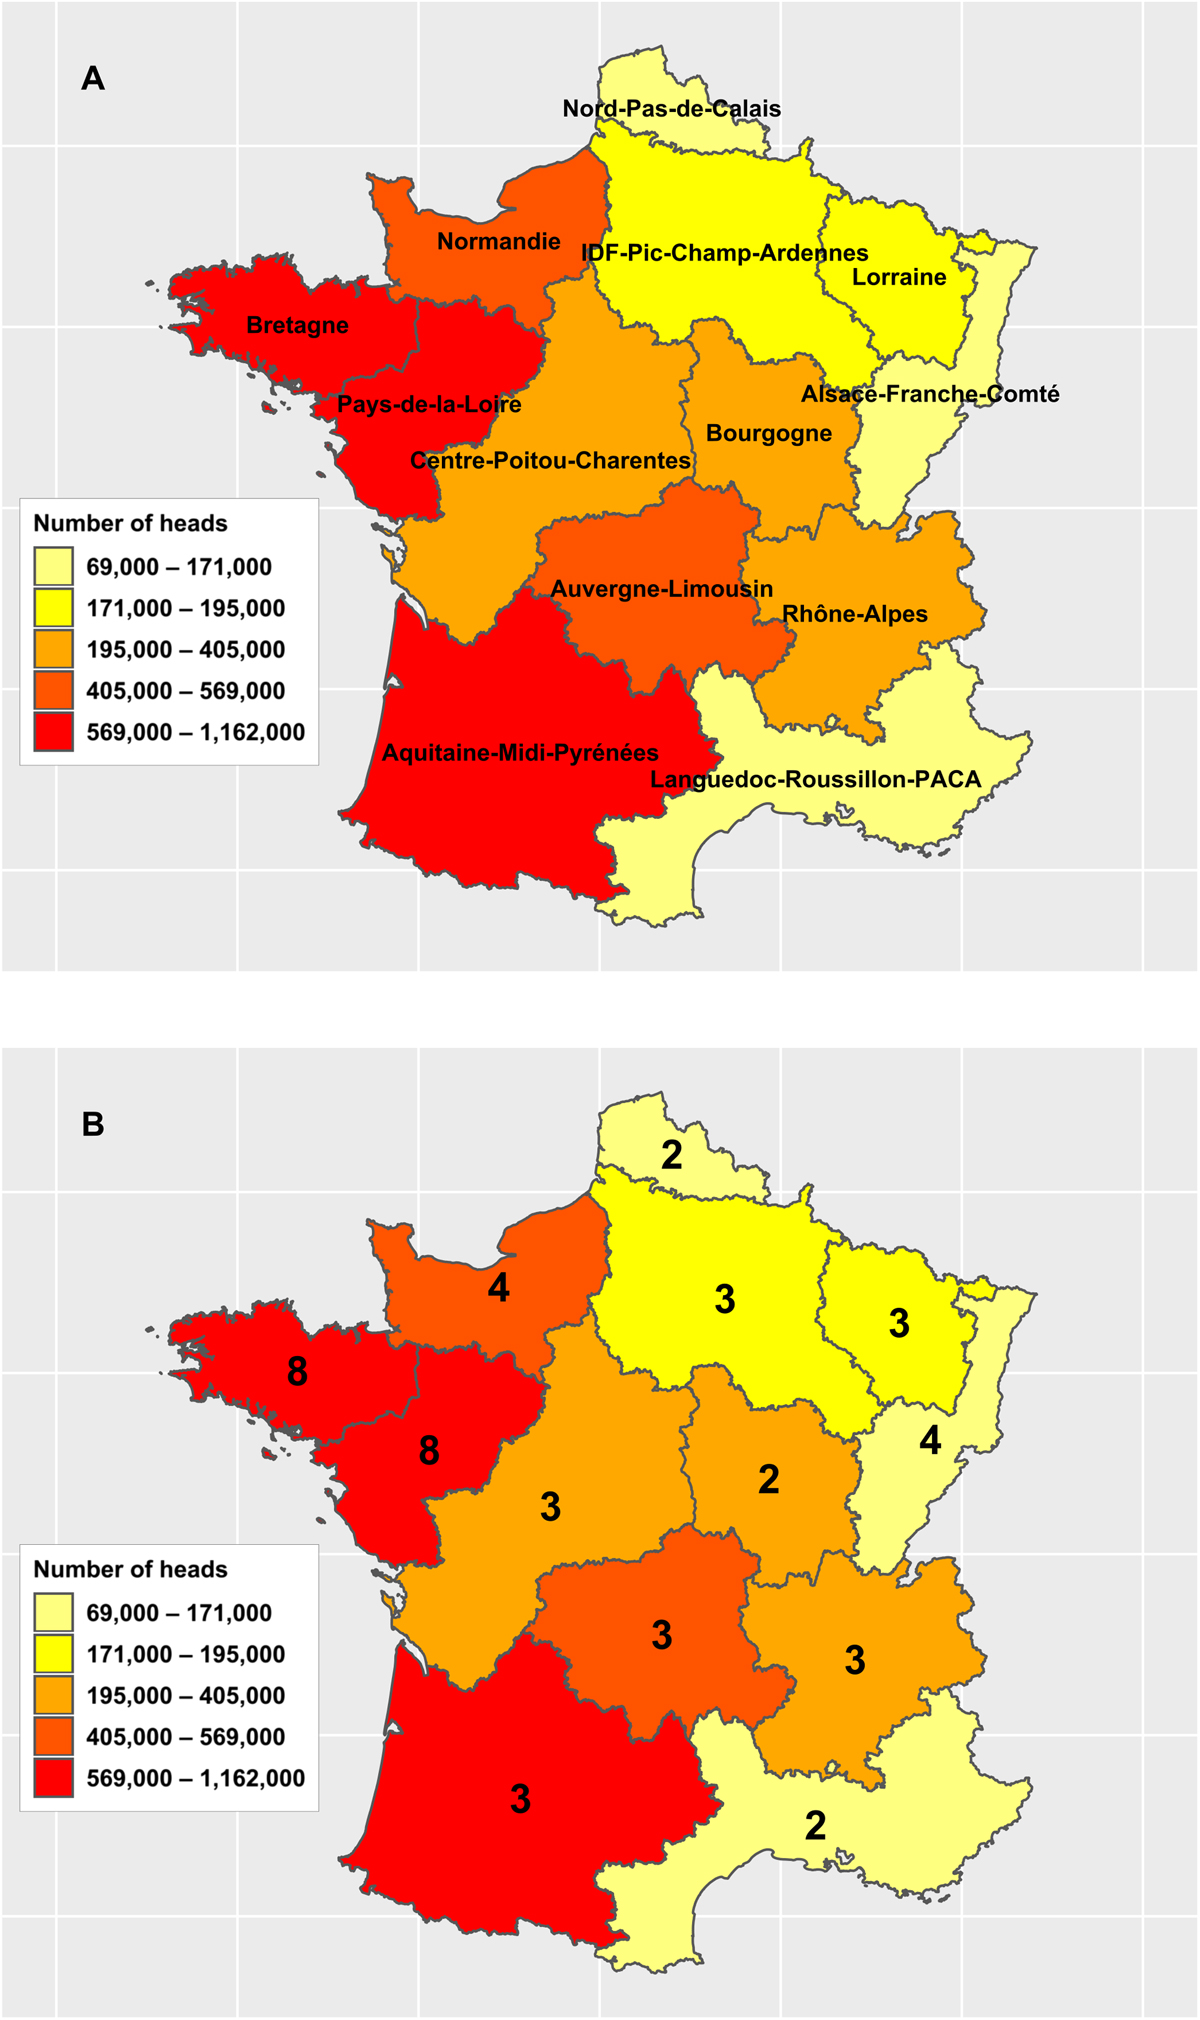
(A) Map of French beef production according to the Ministry of Agriculture database. The colour gradient represents the number of cattle slaughtered in 2007. (B) The numbers represent the number of slaughterhouses per region that were included in the cross-sectional survey of Toxoplasma gondii presence in beef produced in France.
Current usage metrics show cumulative count of Article Views (full-text article views including HTML views, PDF and ePub downloads, according to the available data) and Abstracts Views on Vision4Press platform.
Data correspond to usage on the plateform after 2015. The current usage metrics is available 48-96 hours after online publication and is updated daily on week days.
Initial download of the metrics may take a while.