Figure 4
Download original image
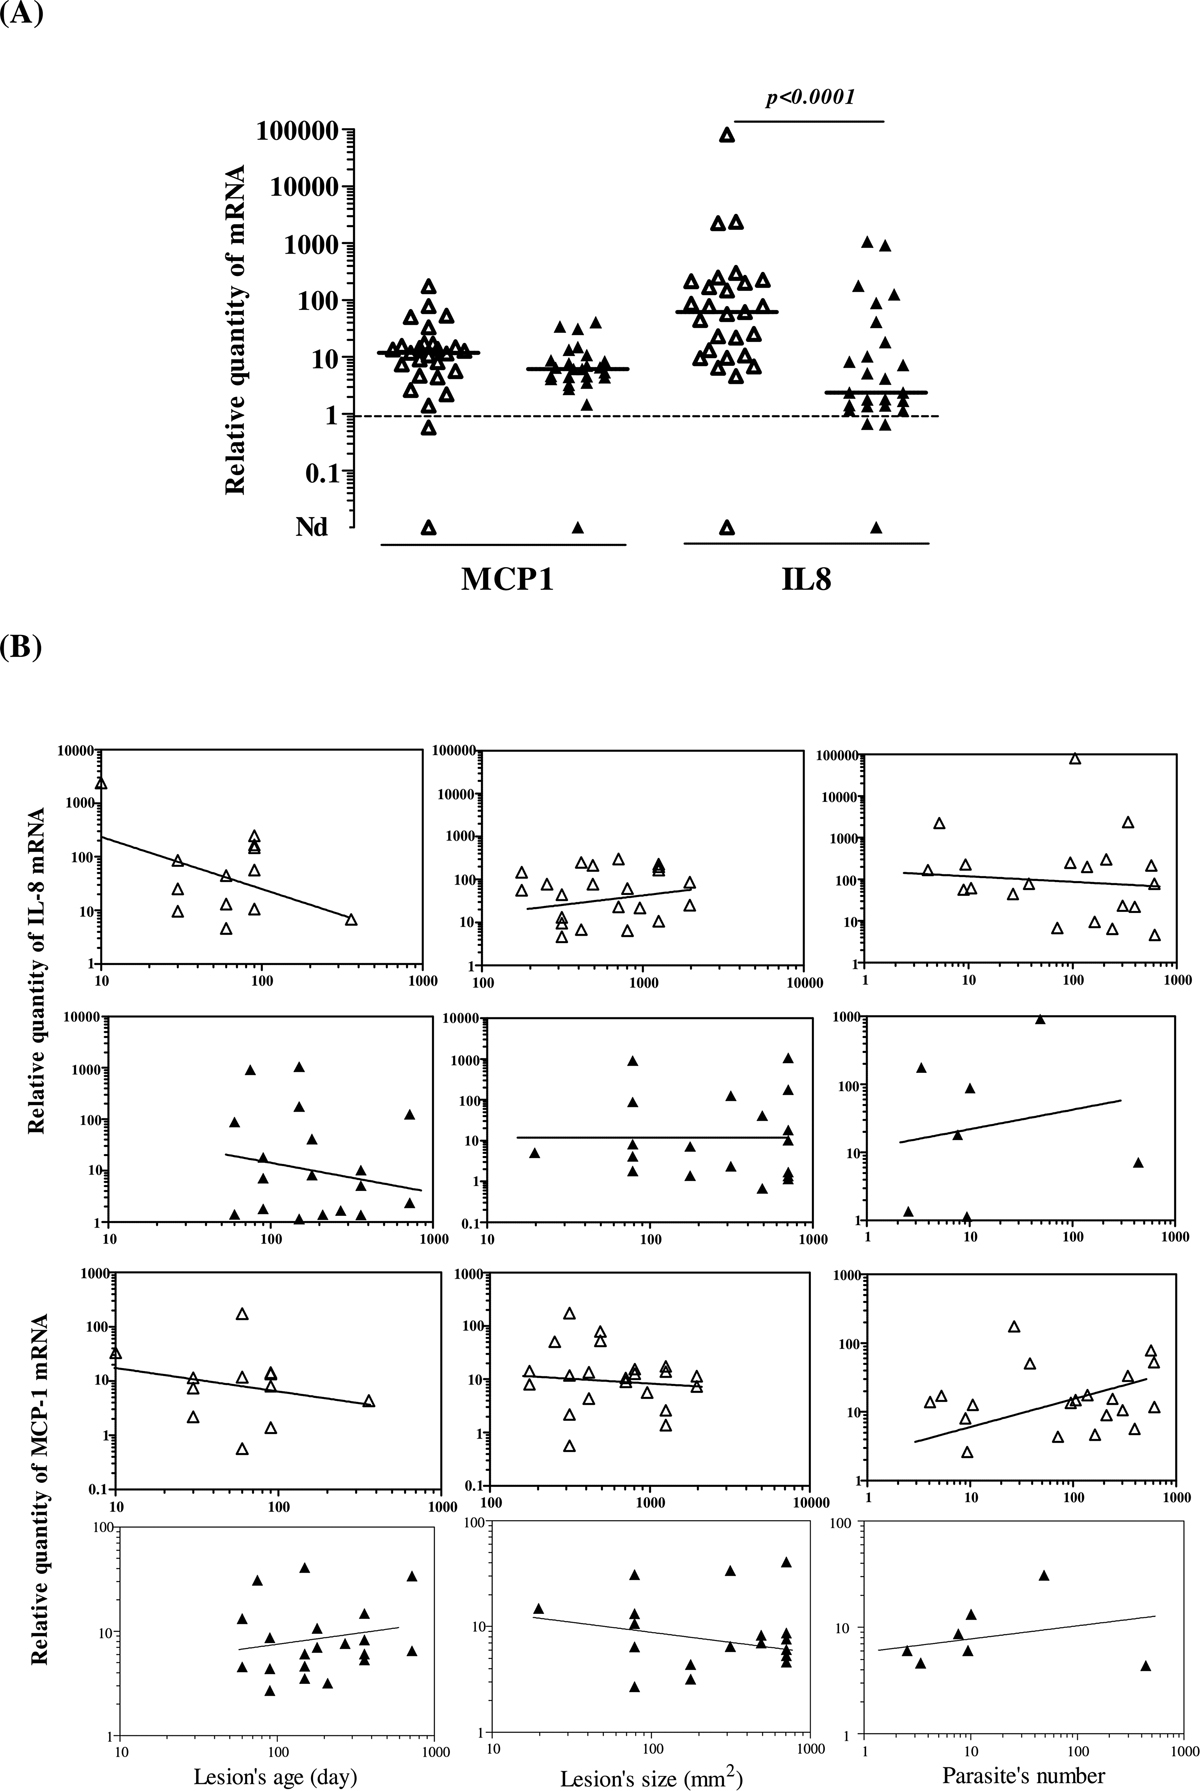
IL-8 and MCP-1 mRNA expression within ZCL and SCL lesions. (A) Dot-plots show individual values of IL-8 and MCP-1 mRNA expression within ZCL (Δ) and SCL (▲) samples. Results are expressed as a ratio between levels of mRNA molecules in studied samples to those detected in normal skin. A horizontal bar indicates the median value of each group. (B) Correlation between IL-8 or MCP-1 mRNA levels and the age of lesions, their size, and the number of parasites they contain. Correlations between different variables were evaluated with the Spearman’s rank correlation test, r: correlation coefficient; p < 0.05 was considered statistically significant.
Current usage metrics show cumulative count of Article Views (full-text article views including HTML views, PDF and ePub downloads, according to the available data) and Abstracts Views on Vision4Press platform.
Data correspond to usage on the plateform after 2015. The current usage metrics is available 48-96 hours after online publication and is updated daily on week days.
Initial download of the metrics may take a while.