Figure 1
Download original image
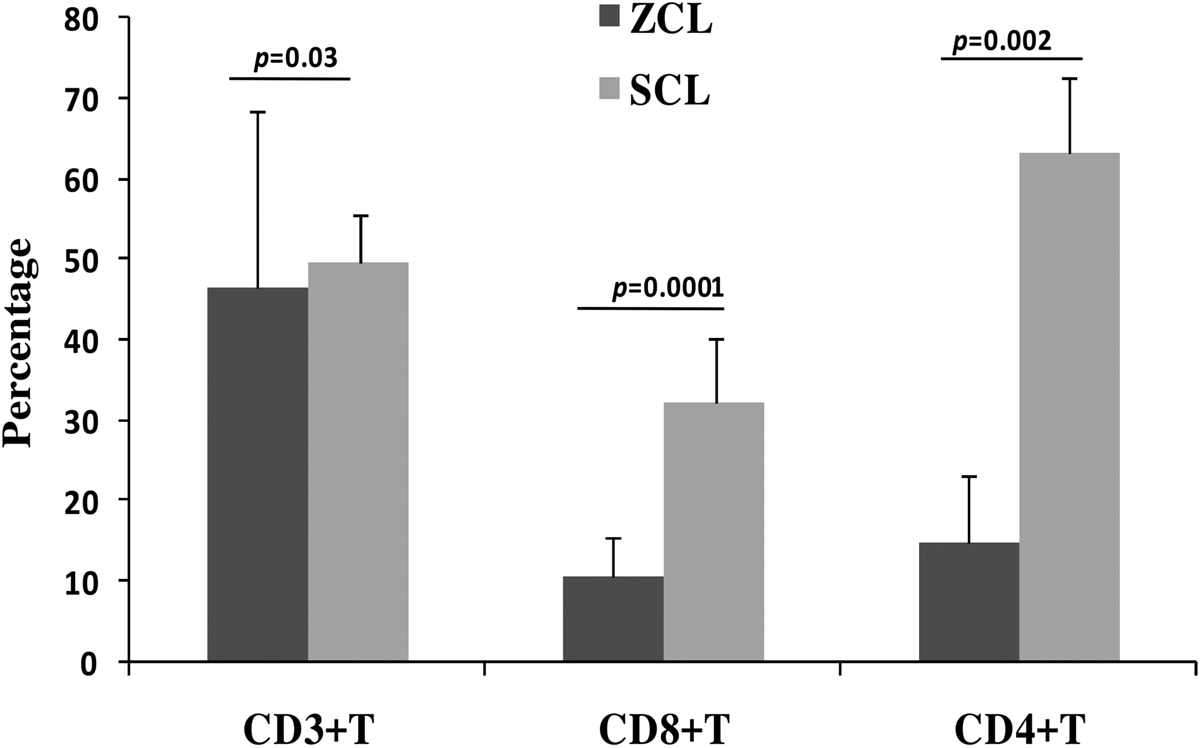
Proportions of CD3+, CD4+ and CD8+ T cells within ZCL and SCL lesions. Histograms represent results of the immunohistochemical analysis expressed as a percentage of positively stained cells among mononuclear cells. Results are expressed as the mean plus the standard error of percentage mean. Any significance found is indicated by a bar on top of each graph connecting the two comparisons. p < 0.05 was considered statistically significant.
Current usage metrics show cumulative count of Article Views (full-text article views including HTML views, PDF and ePub downloads, according to the available data) and Abstracts Views on Vision4Press platform.
Data correspond to usage on the plateform after 2015. The current usage metrics is available 48-96 hours after online publication and is updated daily on week days.
Initial download of the metrics may take a while.