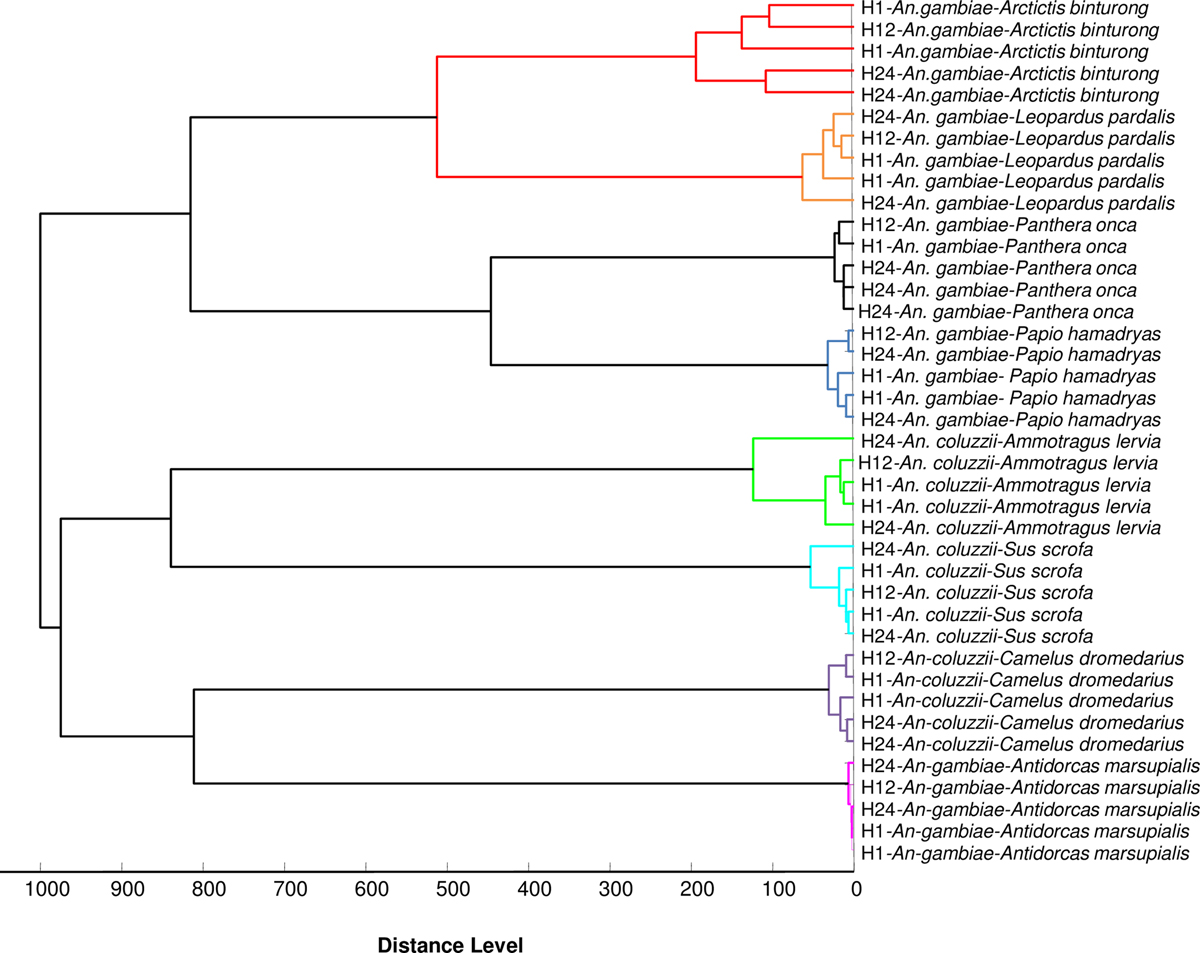
Figure 3.

Download original image
MSP dendrogram of MALDI-TOF MS spectra from Anopheles gambiae Giles and Anopheles coluzzii abdomens collected 1, 12 and 24 h post-feeding. MS spectra from two specimens from 1 to 24 h post-feeding and one specimen from 12 h post-feeding are represented. Blood meal host origins are indicated in the graph. Cluster analysis was performed by MALDI-Biotyper software v.3.3.
Current usage metrics show cumulative count of Article Views (full-text article views including HTML views, PDF and ePub downloads, according to the available data) and Abstracts Views on Vision4Press platform.
Data correspond to usage on the plateform after 2015. The current usage metrics is available 48-96 hours after online publication and is updated daily on week days.
Initial download of the metrics may take a while.


