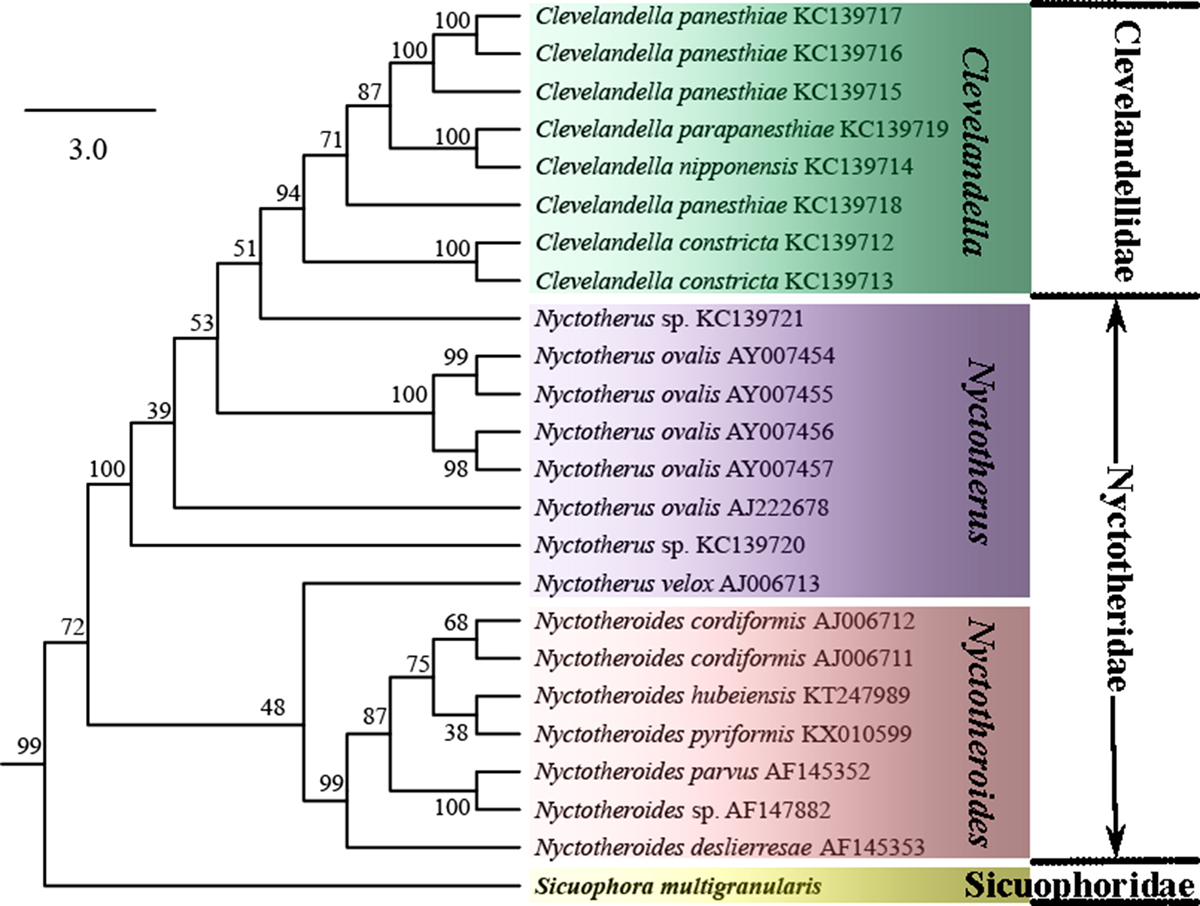
Figure 6.

Download original image
Subtree extracted from the SSU rRNA gene phylogenetic tree inferred by the Maximum Likelihood method, showing only phylogenetic relationships among members of the order Clevelandellida. The bootstrap values are shown next to the branches. The subtree is drawn to scale, with branch lengths measured in the number of substitutions per site.
Current usage metrics show cumulative count of Article Views (full-text article views including HTML views, PDF and ePub downloads, according to the available data) and Abstracts Views on Vision4Press platform.
Data correspond to usage on the plateform after 2015. The current usage metrics is available 48-96 hours after online publication and is updated daily on week days.
Initial download of the metrics may take a while.


