Figure 2
Download original image
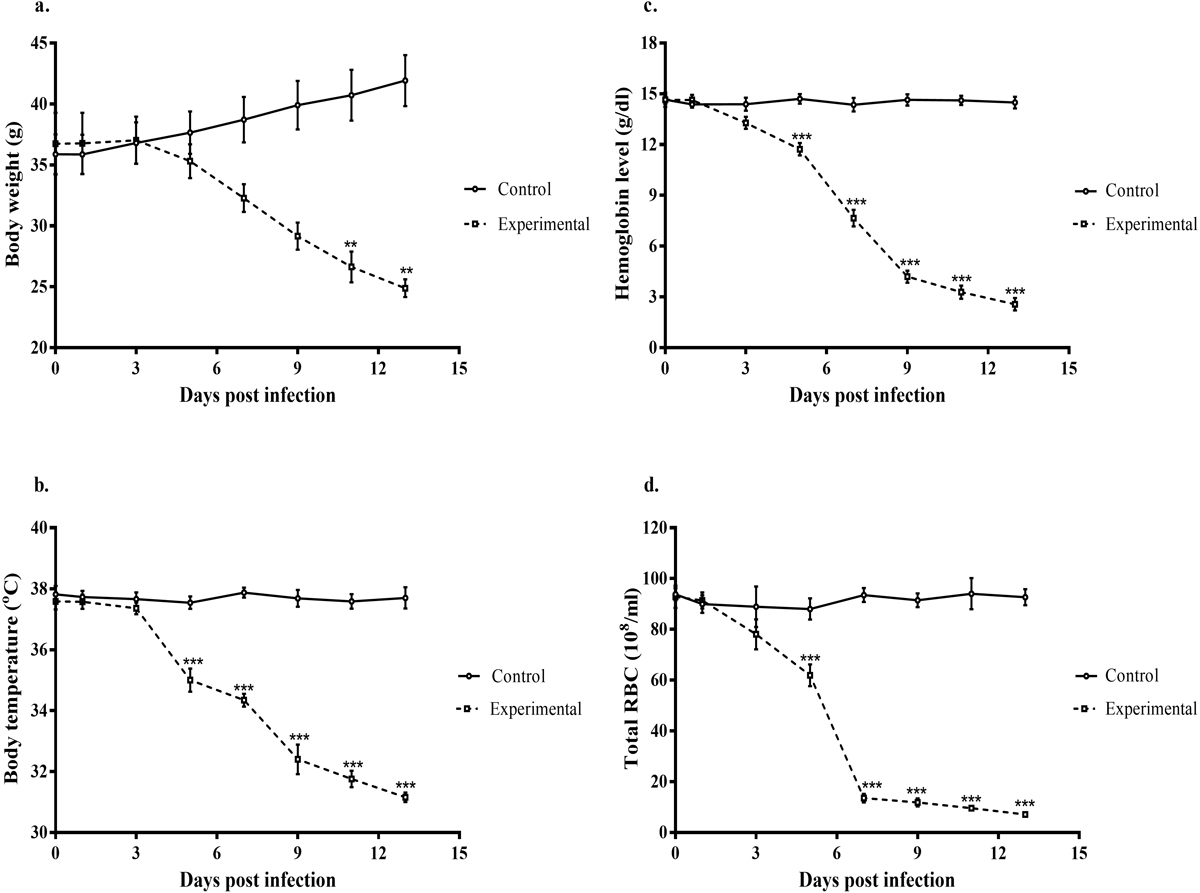
Body weight, body temperature, hemoglobin and total RBC during PbA infection. a. Body weight normalized to the body weight before infection (%). b. Body temperature as measured in infected and control group. c. Hemoglobin level as measured in infected and control group. d. Total RBCs as measured in infected and control group. Lines represent mean ± S.E.M., while N = 7 per group. All data are representative of three independent experiments and compared by one-way analysis of variance (ANOVA) with Tukey's multiple comparison post-hoc test for differences between groups (**p < 0.005; ***p < 0.0001). All data are representative of three different experiments.
Current usage metrics show cumulative count of Article Views (full-text article views including HTML views, PDF and ePub downloads, according to the available data) and Abstracts Views on Vision4Press platform.
Data correspond to usage on the plateform after 2015. The current usage metrics is available 48-96 hours after online publication and is updated daily on week days.
Initial download of the metrics may take a while.