Open Access
Figure 5
Download original image
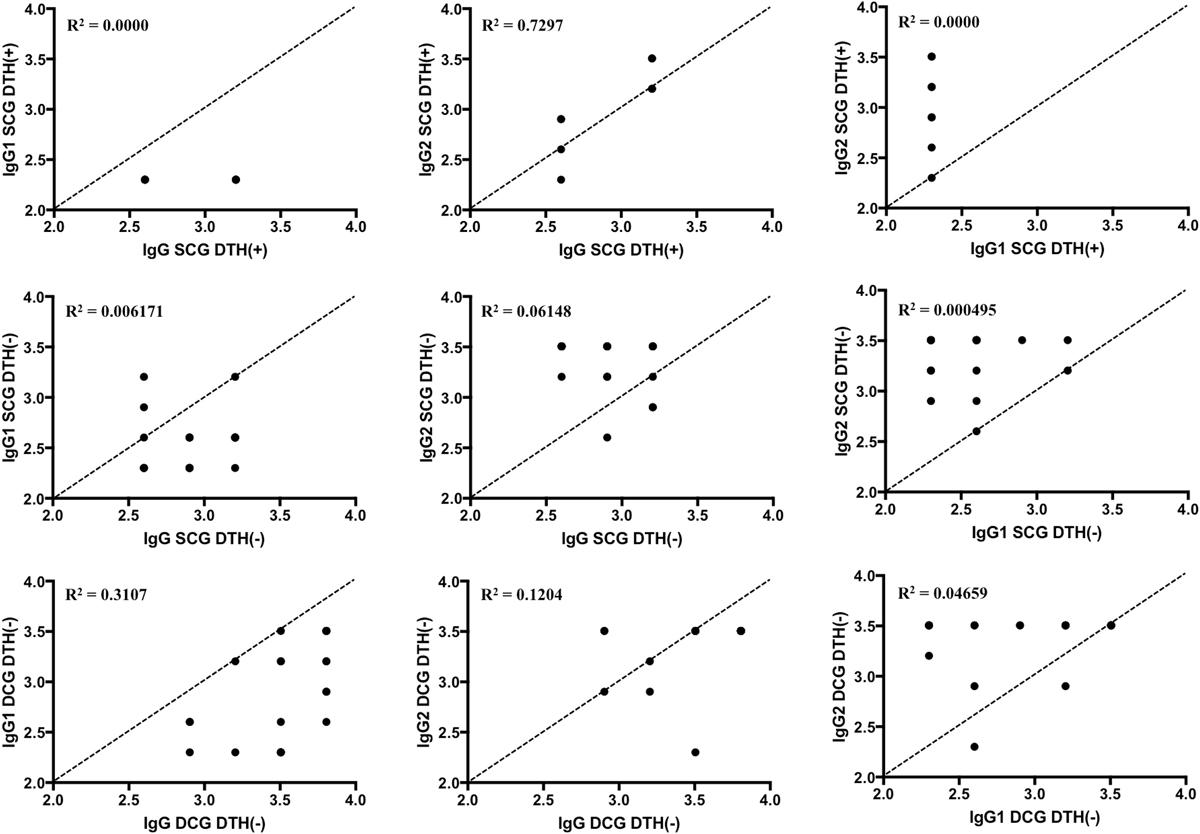
Correlations of log10 transformations of IgG, IgG1, and IgG2 sera titer values of the SCG DTH(+) group (top), SCG DTH(−) group (middle), and DCG DTH(−) group (bottom) obtained using ELISA. The diagonal dashed line indicates what would be a perfect positive correlation (r = 1) between the variables.
Current usage metrics show cumulative count of Article Views (full-text article views including HTML views, PDF and ePub downloads, according to the available data) and Abstracts Views on Vision4Press platform.
Data correspond to usage on the plateform after 2015. The current usage metrics is available 48-96 hours after online publication and is updated daily on week days.
Initial download of the metrics may take a while.