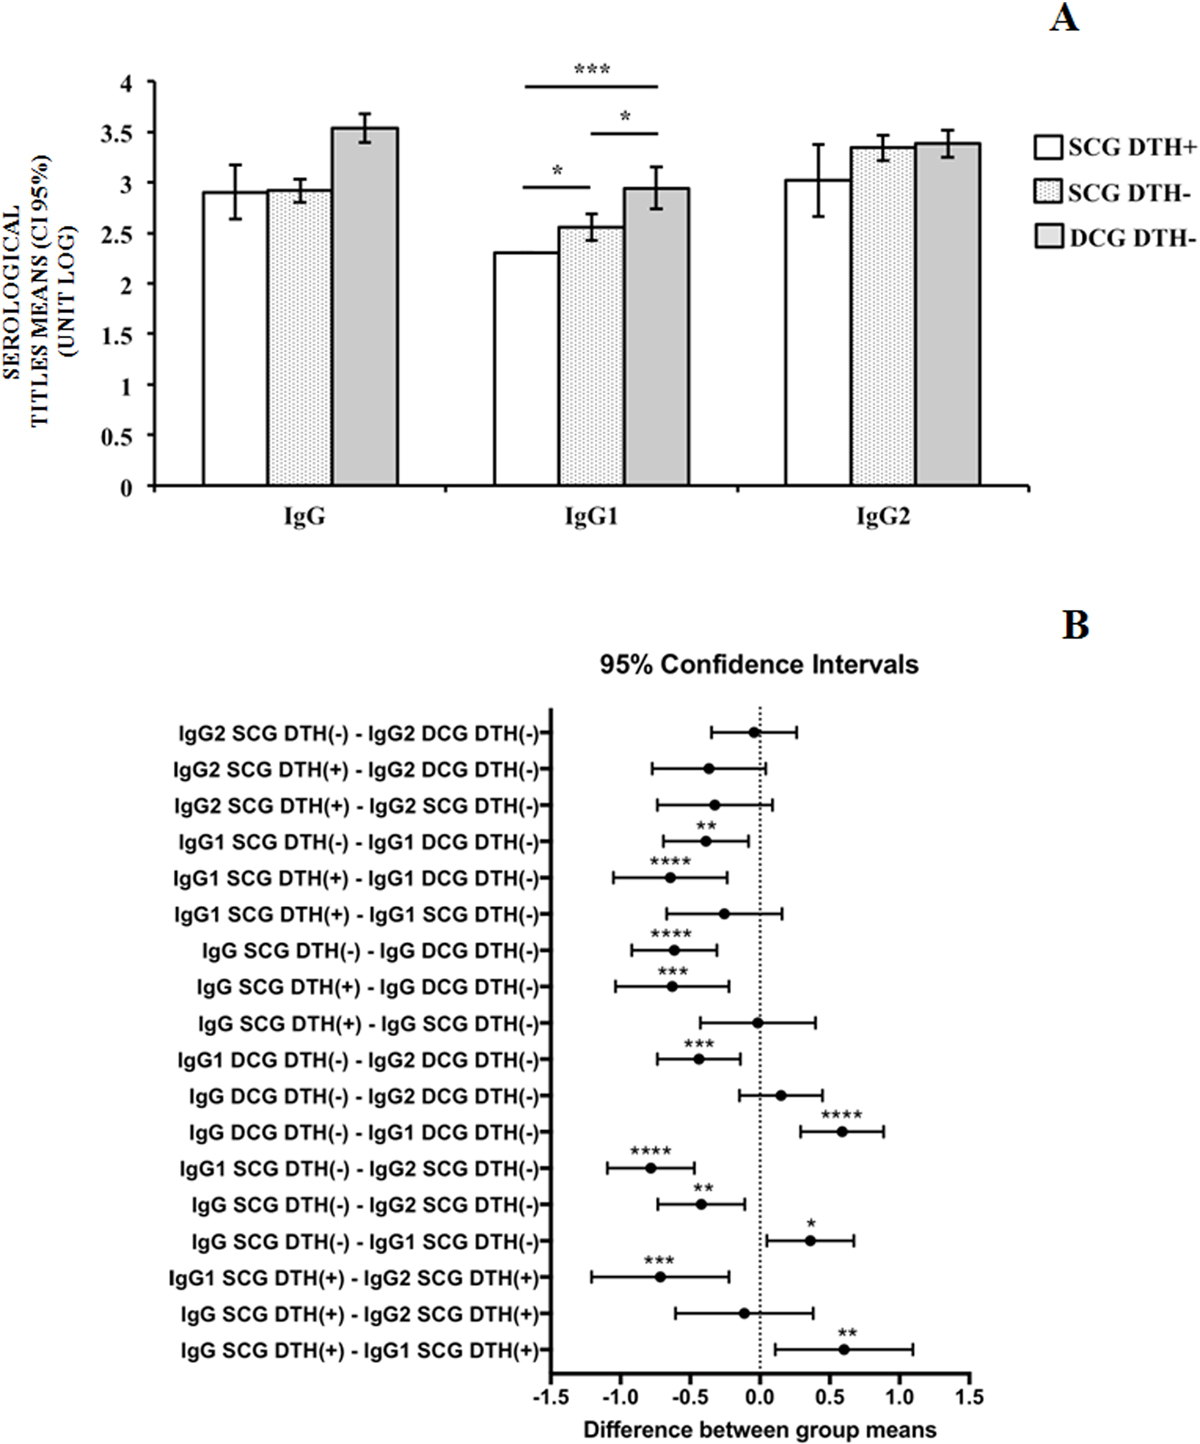
Figure 4
Download original image
The 95% confidence intervals of the differences between the mean titers of IgG, IgG1, and IgG2 obtained by ELISA, considering the variables of clinical states and DTH results together. The vertical dotted line defines the absence of differences between the means evaluated. *, p = 0.0105; **(IgG SCG DTH(+) – IgG1 SCG DTH(+)), p = 0.0054; **(IgG SCG DTH(−)) – IgG2 SCG DTH(−)), p = 0.0012; **(IgG1 SCG DTH(−) – IgG1 DCG DTH(−)), p = 0.0031; ***(IgG1 SCG DTH(+) – IgG2 SCG DTH(+)), p = 0.0004; ***(IgG1 DCG DTH(−) – IgG2 DCG DTH(−)), p = 0.0003; ***(IgG SCG DTH(+) – IgG DCG DTH(−)), p = 0.0001; ****, p < 0.0001.
Current usage metrics show cumulative count of Article Views (full-text article views including HTML views, PDF and ePub downloads, according to the available data) and Abstracts Views on Vision4Press platform.
Data correspond to usage on the plateform after 2015. The current usage metrics is available 48-96 hours after online publication and is updated daily on week days.
Initial download of the metrics may take a while.