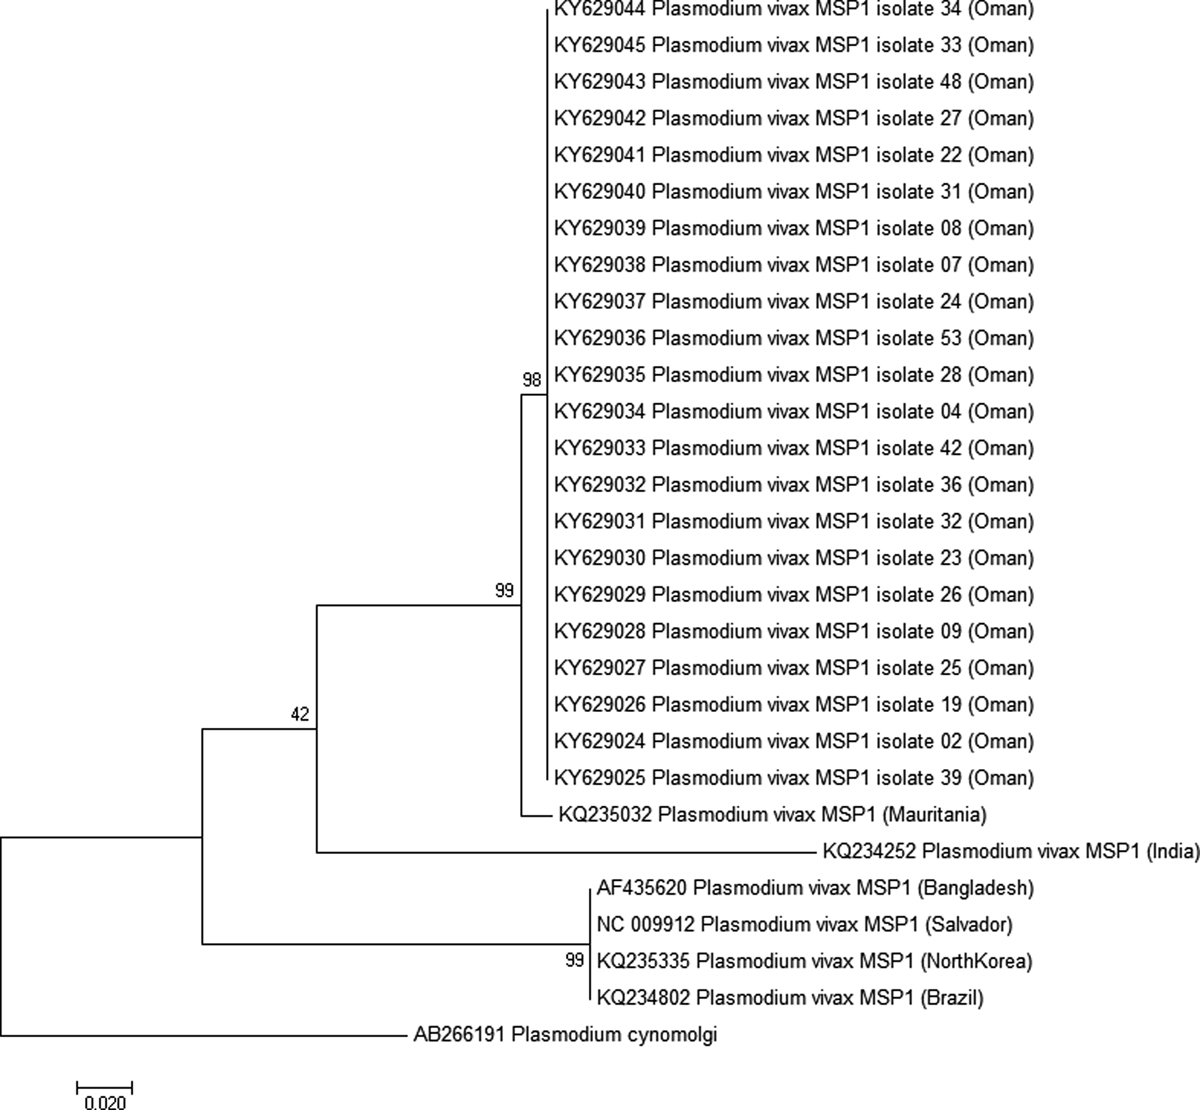
Figure 3.
Download original image
Molecular phylogenetic analysis by maximum likelihood method for the 22 sequences of Pvmsp1 protein from Oman and six reference strains. The evolutionary history was inferred by using the maximum likelihood method based on the Tamura-Nei model [36]. The tree with the highest log likelihood (−880.6611) is shown. The tree is drawn to scale, with branch lengths measured in the number of substitutions per site. The analysis involved 29 nucleotide sequences. All positions containing gaps and missing data were eliminated. There were a total of 243 positions in the final dataset. Evolutionary analyses were conducted in MEGA7 [21]. The tree was rooted on Plasmodium cynomolgi msp1. Bootstrap test results are shown next to the branches.
Current usage metrics show cumulative count of Article Views (full-text article views including HTML views, PDF and ePub downloads, according to the available data) and Abstracts Views on Vision4Press platform.
Data correspond to usage on the plateform after 2015. The current usage metrics is available 48-96 hours after online publication and is updated daily on week days.
Initial download of the metrics may take a while.