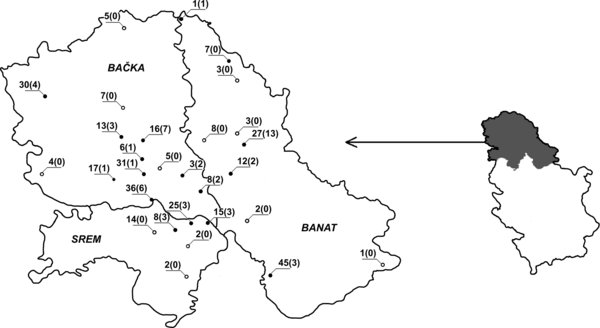
Figure 1.
Download original image
Dots on the map of Vojvodina represent localities where blood samples were taken from cows or, in the case of blood collected at the abattoir, places of cows’ origin. Black dots refer to localities where seropositive cows were found, while white dots stand for localities where there were no positive samples. Figures represent the number of sampled cows from specific locality and number of positive ones (between parentheses).
Current usage metrics show cumulative count of Article Views (full-text article views including HTML views, PDF and ePub downloads, according to the available data) and Abstracts Views on Vision4Press platform.
Data correspond to usage on the plateform after 2015. The current usage metrics is available 48-96 hours after online publication and is updated daily on week days.
Initial download of the metrics may take a while.