Figure 1.

Download original image
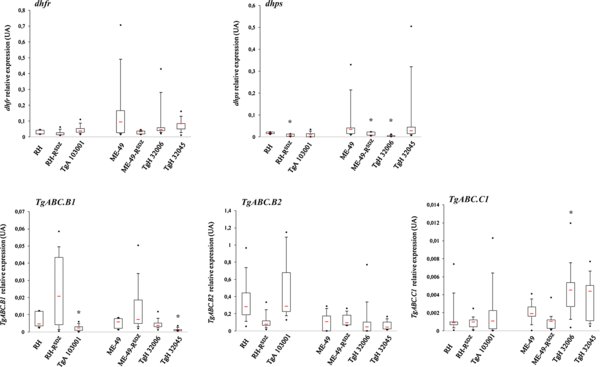
Relative expression of dhps, dhfr, TgABC.B1, TgABC.B2, and TgABC.C1 genes in two sensitive strains H (I) ME-49 (II), and the induced-resistant strains, RH-RSDZ and ME-49-RSDZ, and naturally resistant strains TgA 103001, TgH 32006, and TgH 32045 by qRT-PCR analysis. Red bars represent median value. Black points represent maximum and minimum values. Black bars represent first and tenth decile and limits of white rectangle represents first and third quartile.
Current usage metrics show cumulative count of Article Views (full-text article views including HTML views, PDF and ePub downloads, according to the available data) and Abstracts Views on Vision4Press platform.
Data correspond to usage on the plateform after 2015. The current usage metrics is available 48-96 hours after online publication and is updated daily on week days.
Initial download of the metrics may take a while.


