Figure 5
Download original image
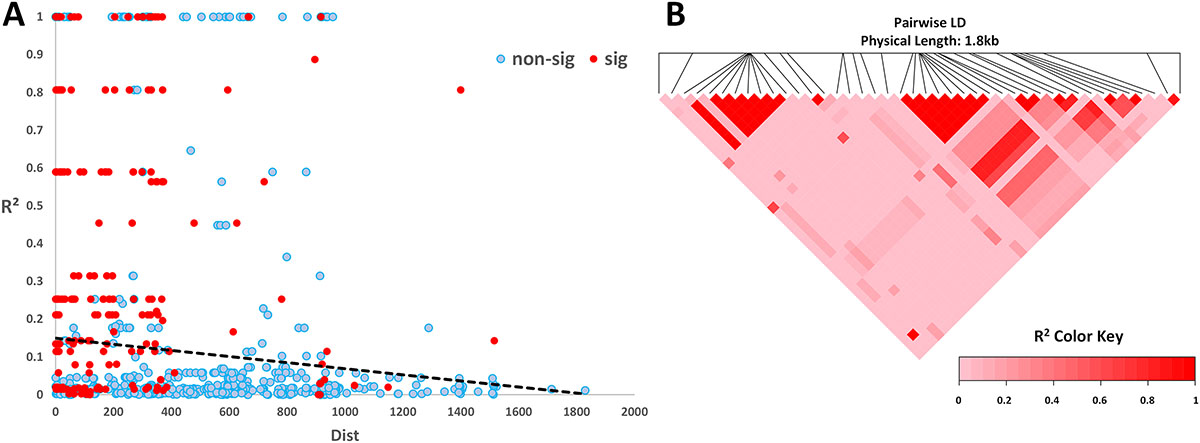
Linkage disequilibrium analysis of the DBLMSP1-1 genotype. (A) Scatter plot of pairwise LD (R2) against physical distance between SNPs. Significant LD values (p < 0.05) are shown in red; nonsignificant in blue. Although LD generally decays with distance, long-range LD blocks are evident within the ~1.8 kb region. (B) LD heatmap of pairwise SNP correlations across the same region. Several distinct LD blocks are observed, suggesting that recombination may preferentially occur between rather than within modular segments. Alternatively, strong LD could reflect selective retention of functionally compatible haplotypes, shaped by fitness constraints rather than solely by recombination suppression.
Current usage metrics show cumulative count of Article Views (full-text article views including HTML views, PDF and ePub downloads, according to the available data) and Abstracts Views on Vision4Press platform.
Data correspond to usage on the plateform after 2015. The current usage metrics is available 48-96 hours after online publication and is updated daily on week days.
Initial download of the metrics may take a while.