Figure 4
Download original image
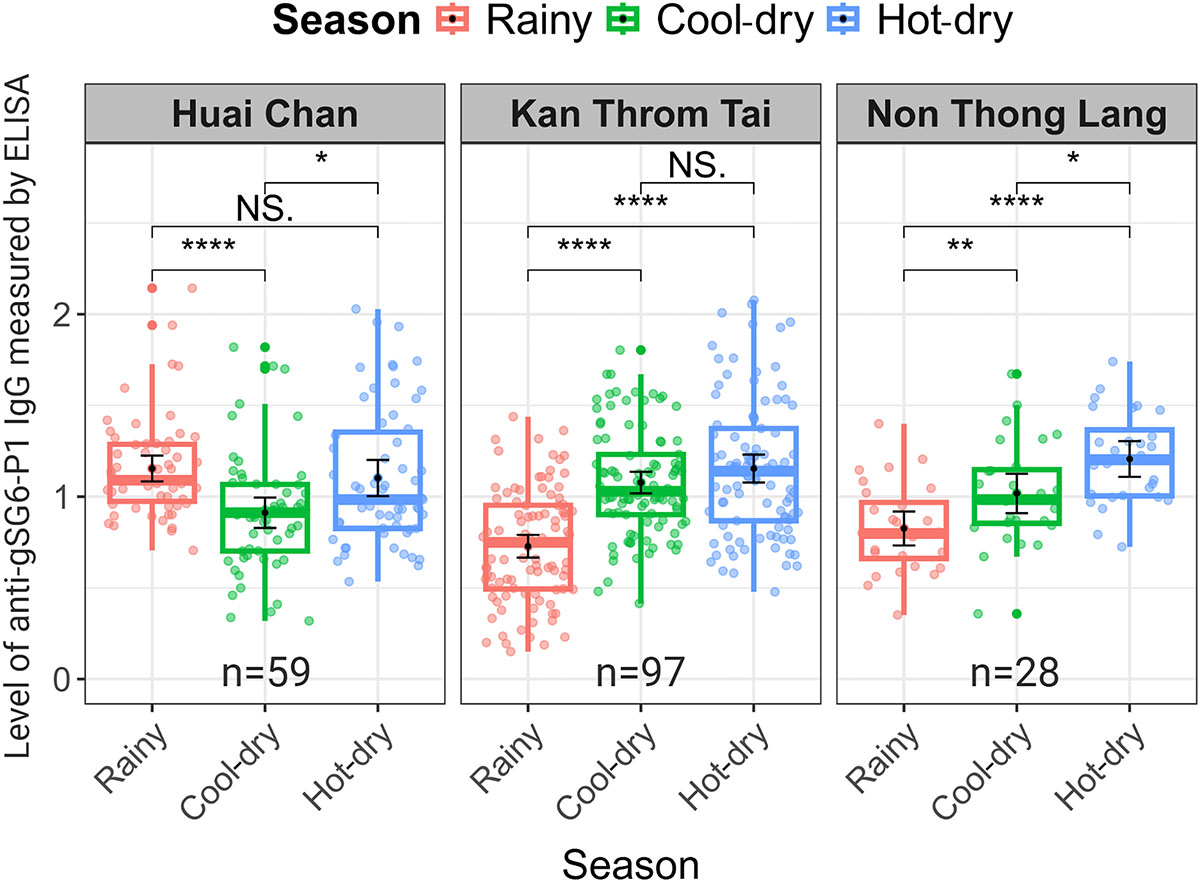
Spatial-temporal dynamics of IgG responses among all participants across three seasons in each village. The box plot displays the interquartile range, and the whiskers indicate the range of maximum and minimum values. The dot plots display the raw data from each individual. Statistical analyses were performed using the Wilcoxon Signed-Rank Test, with significance levels indicated as p < 0.05 (*) and p < 0.001 (***), p < 0.0001 (****), while NS indicates no significant difference p > 0.05.
Current usage metrics show cumulative count of Article Views (full-text article views including HTML views, PDF and ePub downloads, according to the available data) and Abstracts Views on Vision4Press platform.
Data correspond to usage on the plateform after 2015. The current usage metrics is available 48-96 hours after online publication and is updated daily on week days.
Initial download of the metrics may take a while.