Figure 3
Download original image
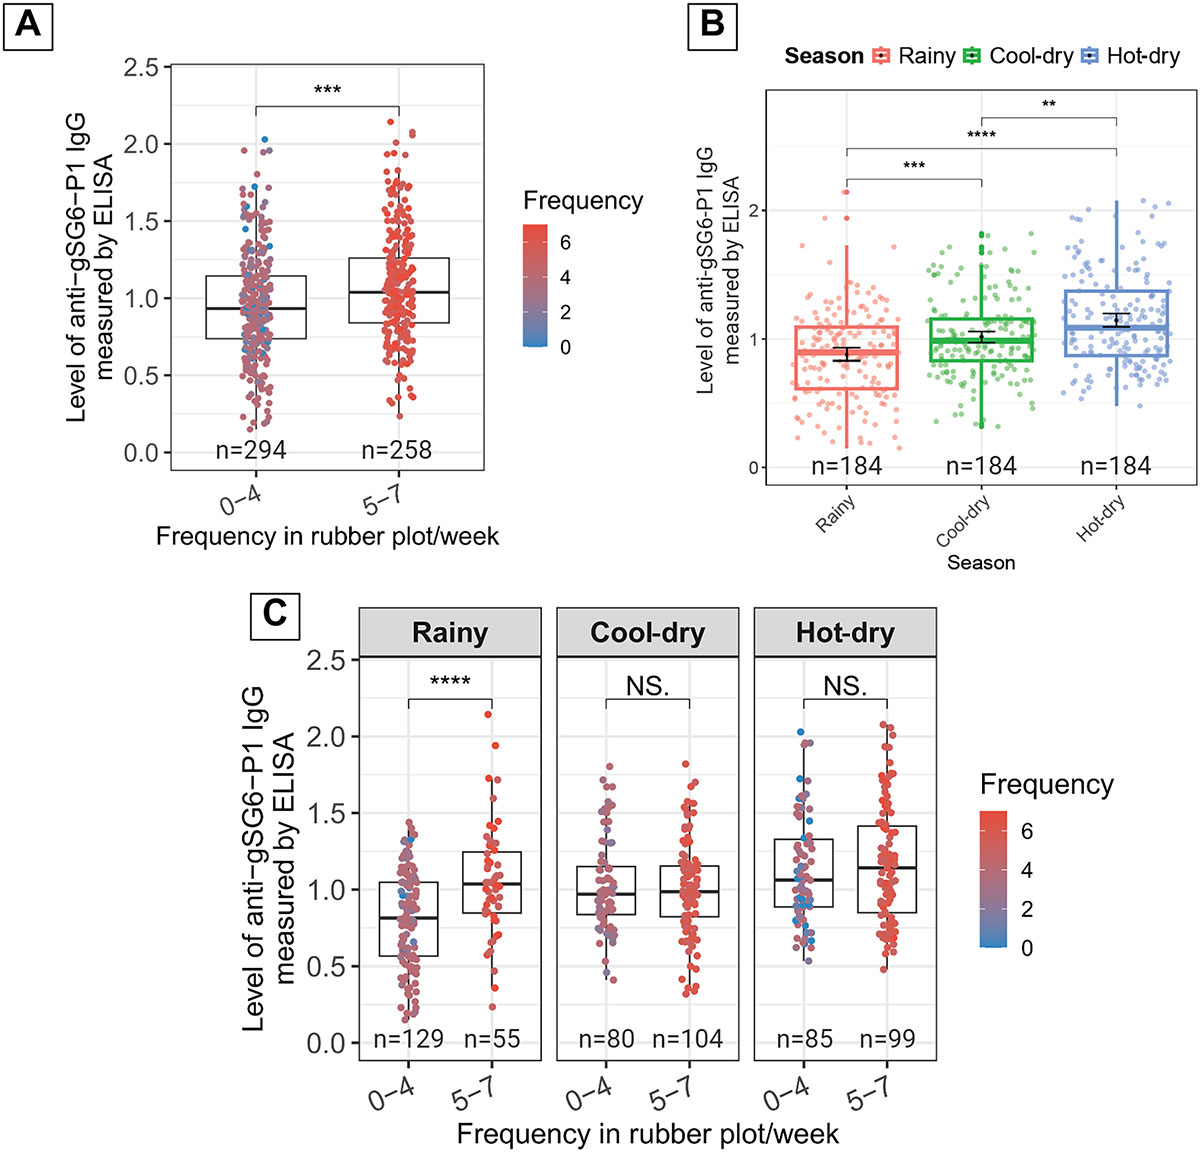
Frequency of entering the rubber plot/week and seasonal variables affecting anti-gSG6-P1 response. (A) Box plot comparing levels of anti-gSG6-P1 between participants with low- and high-rubber plot visit frequency. Higher IgG responses were associated with more frequent visits to the rubber plot, regardless of seasonal variation. (B) Box plot demonstrating temporal dynamics of IgG responses across three seasons. (C) Box plot demonstrating the combined effect of season and rubber plot entry frequency on anti-gSG6-P1 IgG levels. The box plot displays the interquartile range, and the whiskers indicate the range of maximum and minimum values. The dot plots display the raw data from each individual. Statistical analyses were performed using the Wilcoxon Rank-Sum Test, with significance levels indicated as p < 0.05 (*), p < 0.01 (**), p < 0.001 (***), p < 0.0001 (****), while NS indicates no statistically significant p > 0.05.
Current usage metrics show cumulative count of Article Views (full-text article views including HTML views, PDF and ePub downloads, according to the available data) and Abstracts Views on Vision4Press platform.
Data correspond to usage on the plateform after 2015. The current usage metrics is available 48-96 hours after online publication and is updated daily on week days.
Initial download of the metrics may take a while.