Figure 2
Download original image
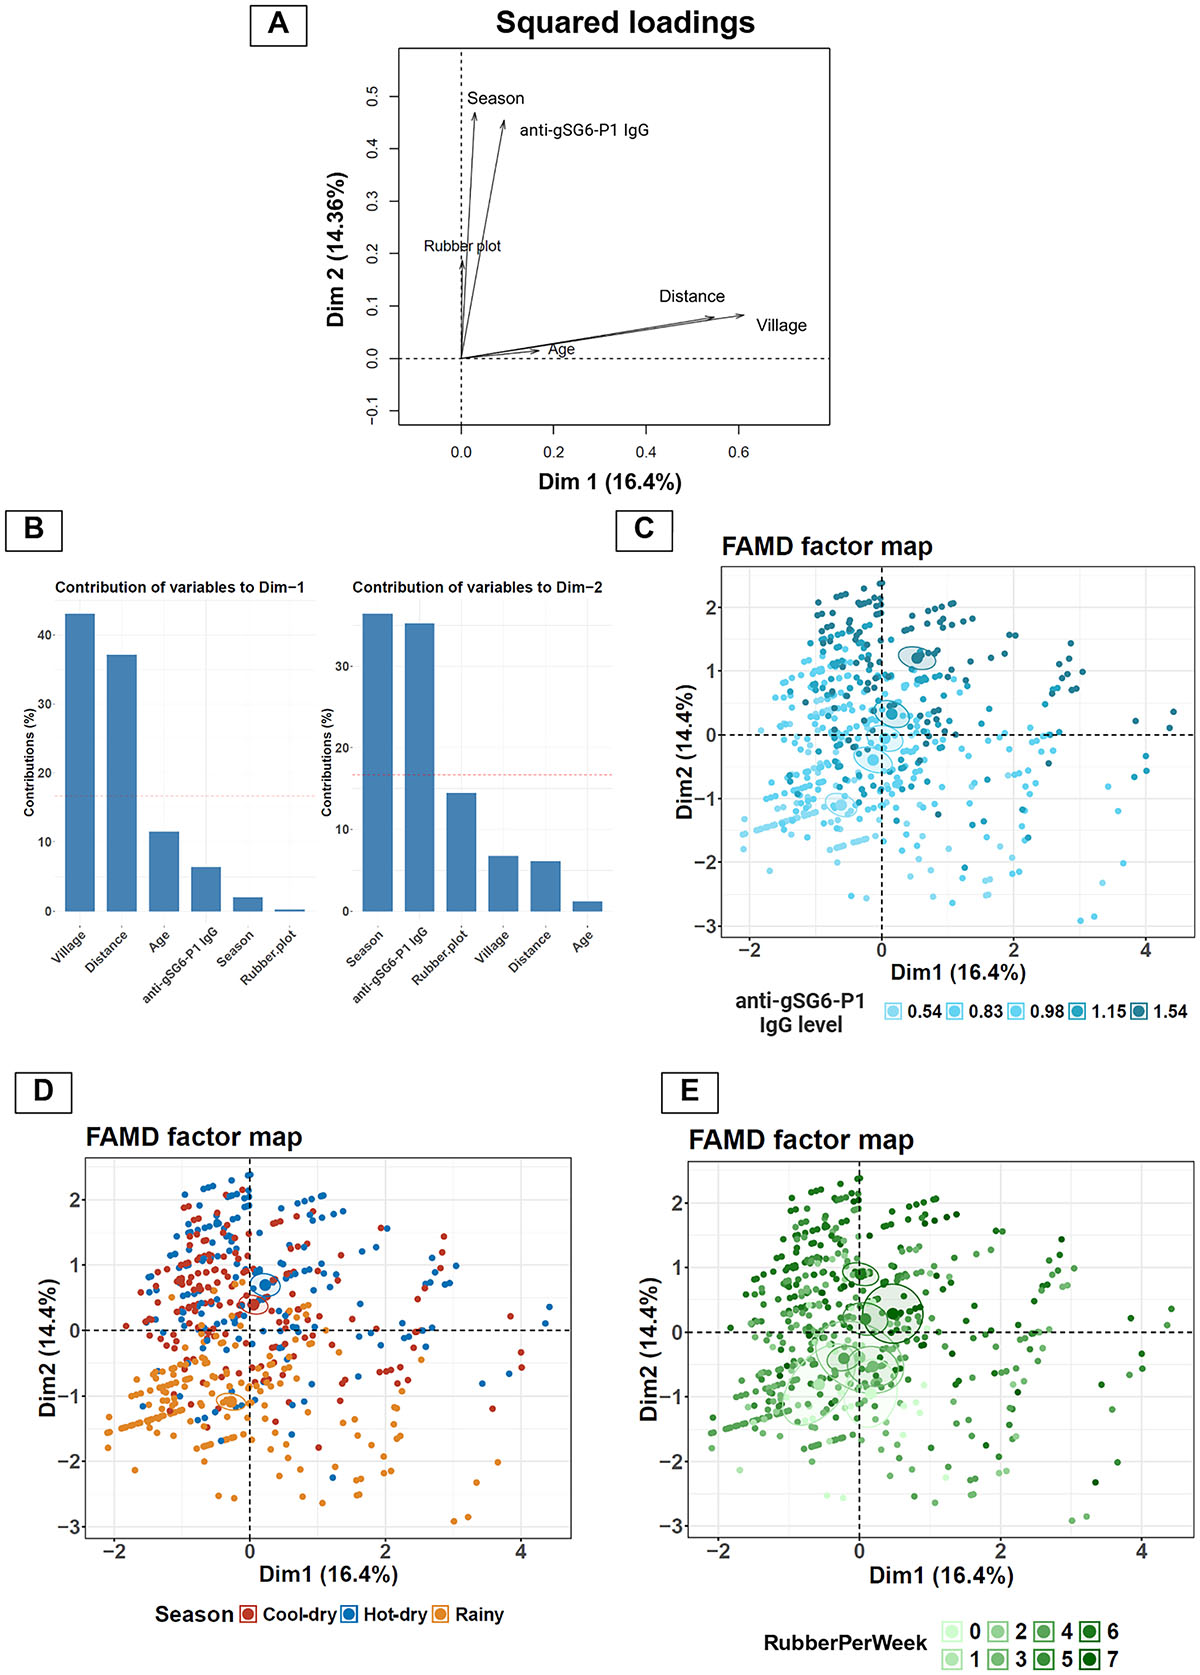
FAMD analysis reveals underlying variables influencing the level of anti-gSG6-P1 responses. (A) Squared loadings plot demonstrating the correlations between categorical and continuous variables with Dims 1 and 2. (B) Plots demonstrating contributions of each variable to Dims-1 and -2. (C–E) FAMD factor maps represents coordinates of each sample on the Dims-1 and -2, with color overlays indicating (C) IgG response levels, (D) season, and (E) frequency of rubber plot entry per week (RubberPerWeek).
Current usage metrics show cumulative count of Article Views (full-text article views including HTML views, PDF and ePub downloads, according to the available data) and Abstracts Views on Vision4Press platform.
Data correspond to usage on the plateform after 2015. The current usage metrics is available 48-96 hours after online publication and is updated daily on week days.
Initial download of the metrics may take a while.