Figure 2
Download original image
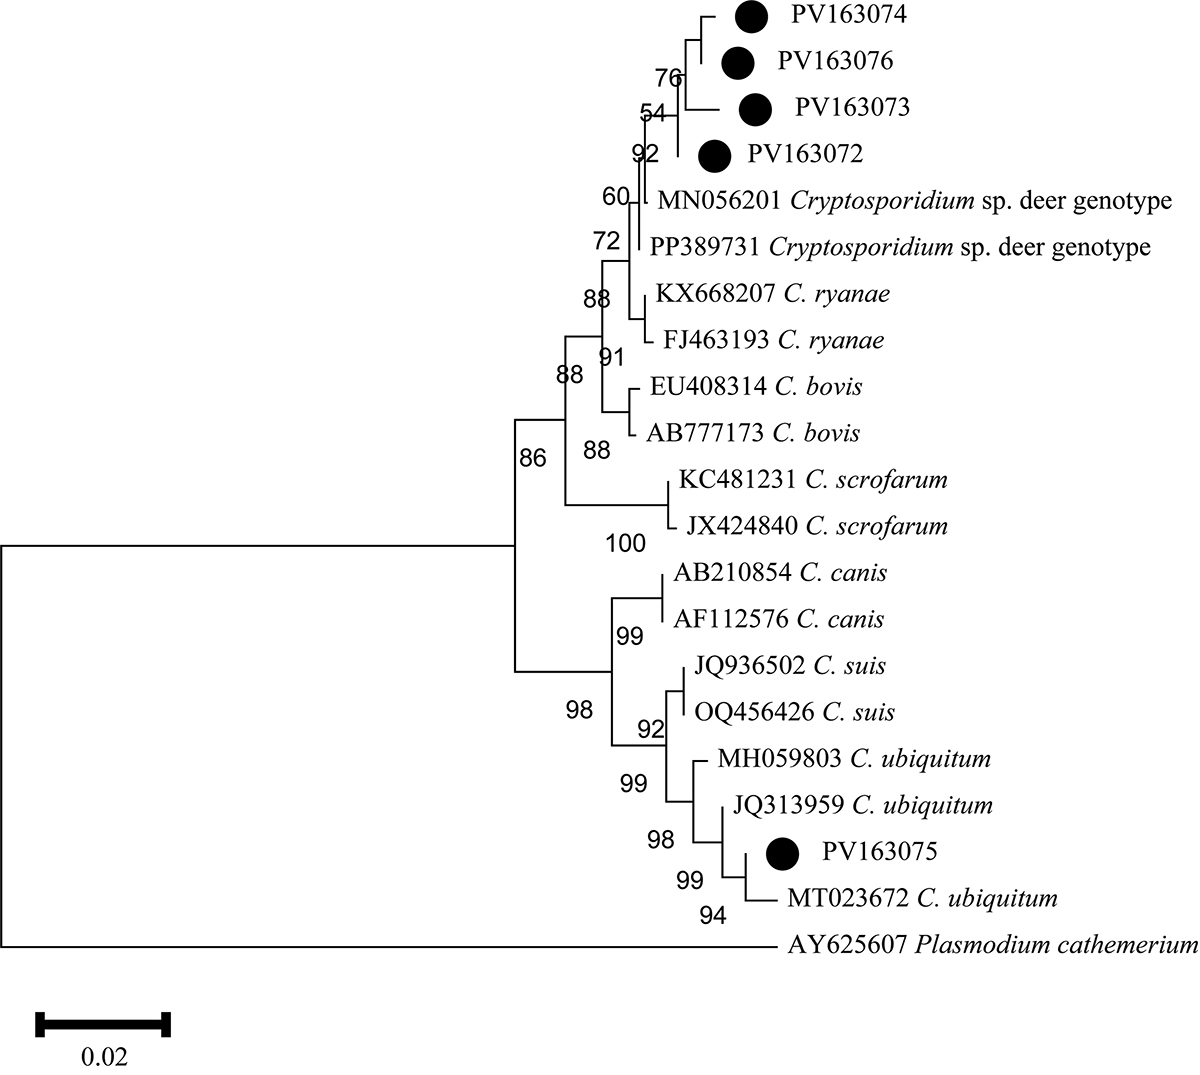
Phylogenetic relationships between the sequences in this study and the reference sequences of Cryptosporidium in GenBank and an outgroup, using a neighbor-joining (NJ) method. The genetic distance was calculated based on the Kimura 2-parameter model. Representative nucleotide sequences identified in this study are marked by black dots. The numbers on the branches represent the bootstrap percentage values for 1,000 replicates and are shown in the tree with values greater than 50%.
Current usage metrics show cumulative count of Article Views (full-text article views including HTML views, PDF and ePub downloads, according to the available data) and Abstracts Views on Vision4Press platform.
Data correspond to usage on the plateform after 2015. The current usage metrics is available 48-96 hours after online publication and is updated daily on week days.
Initial download of the metrics may take a while.