Figure 8
Download original image
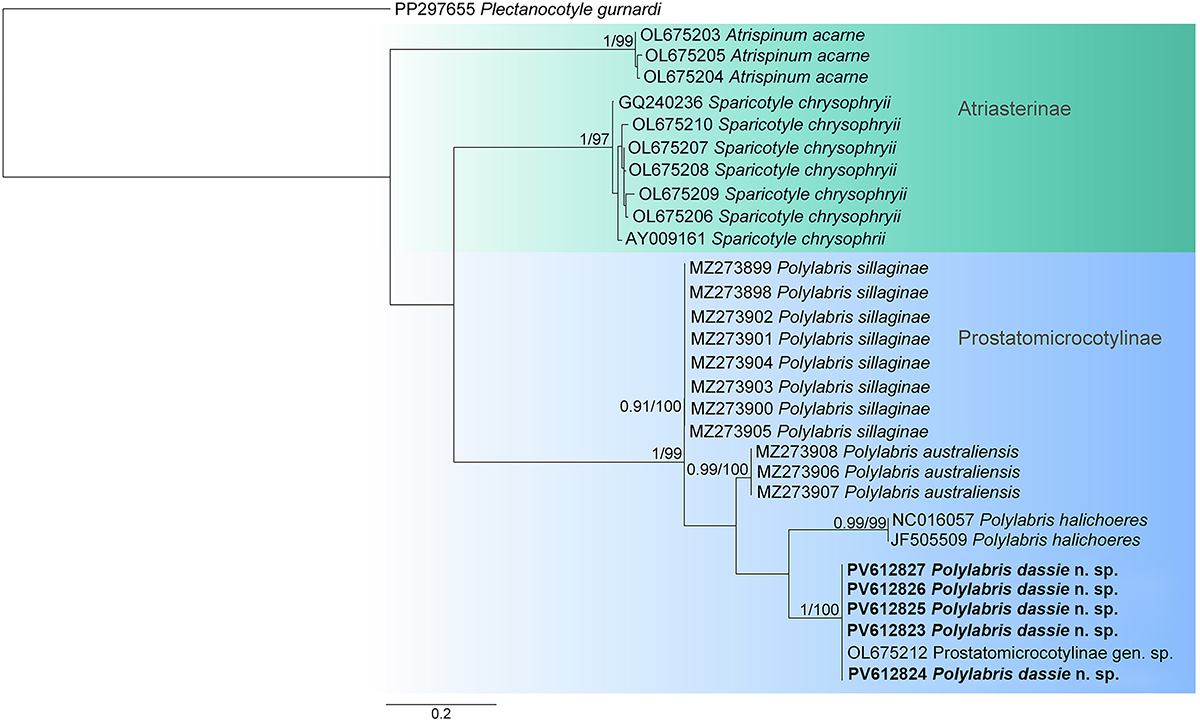
Maximum likelihood phylogram based on sequences of the COI mtDNA gene of selected polyopisthocotylan species. Newly sequenced isolates are in bold. Posterior probability followed by bootstrap support values are given next to the branches (posterior probability < 0.90 and bootstrap < 60 not shown). Plectanocotyle gurnardi (Van Beneden & Hesse, 1863) Llewellyn, 1941 was used as an outgroup. Branch length scale bar indicates number of substitutions per site.
Current usage metrics show cumulative count of Article Views (full-text article views including HTML views, PDF and ePub downloads, according to the available data) and Abstracts Views on Vision4Press platform.
Data correspond to usage on the plateform after 2015. The current usage metrics is available 48-96 hours after online publication and is updated daily on week days.
Initial download of the metrics may take a while.