Figure 4
Download original image
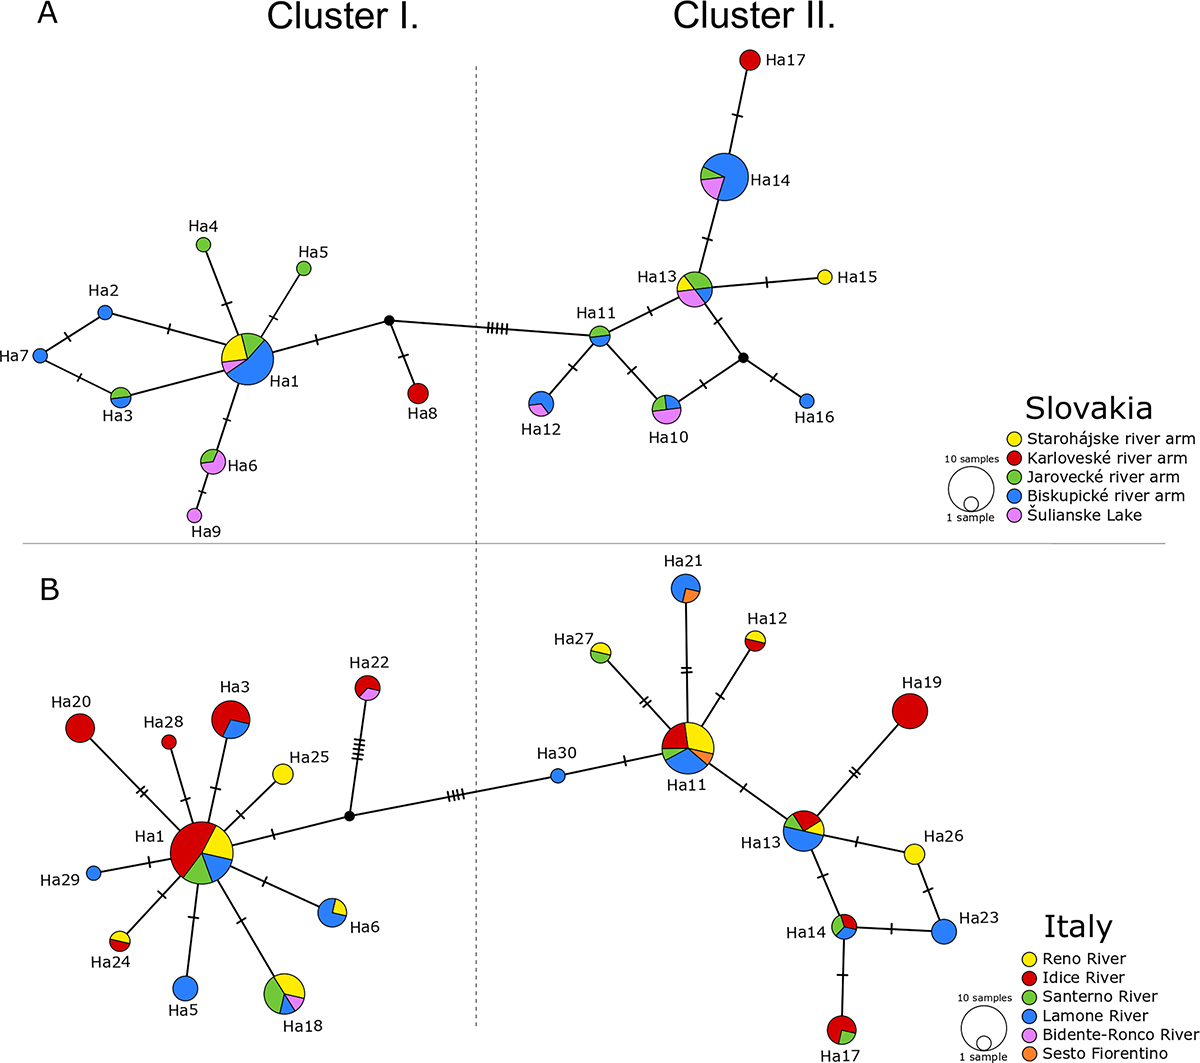
Haplotype network diagram of analysis no. 1 (828 bp; Fig. 3, blue lines) based on mitochondrial cox1 haplotypes of Clinostomum complanatum from (A) Slovakia; (B) Italy. The size of the haplotypes is proportional to the number of samples. Each hatch mark represents a single mutation, while black dots symbolize missing or unsampled haplotype. Details on haplotype numbers are given in Table 3 (Slovakia) and Table 4 (Italy).
Current usage metrics show cumulative count of Article Views (full-text article views including HTML views, PDF and ePub downloads, according to the available data) and Abstracts Views on Vision4Press platform.
Data correspond to usage on the plateform after 2015. The current usage metrics is available 48-96 hours after online publication and is updated daily on week days.
Initial download of the metrics may take a while.