Figure 1
Download original image
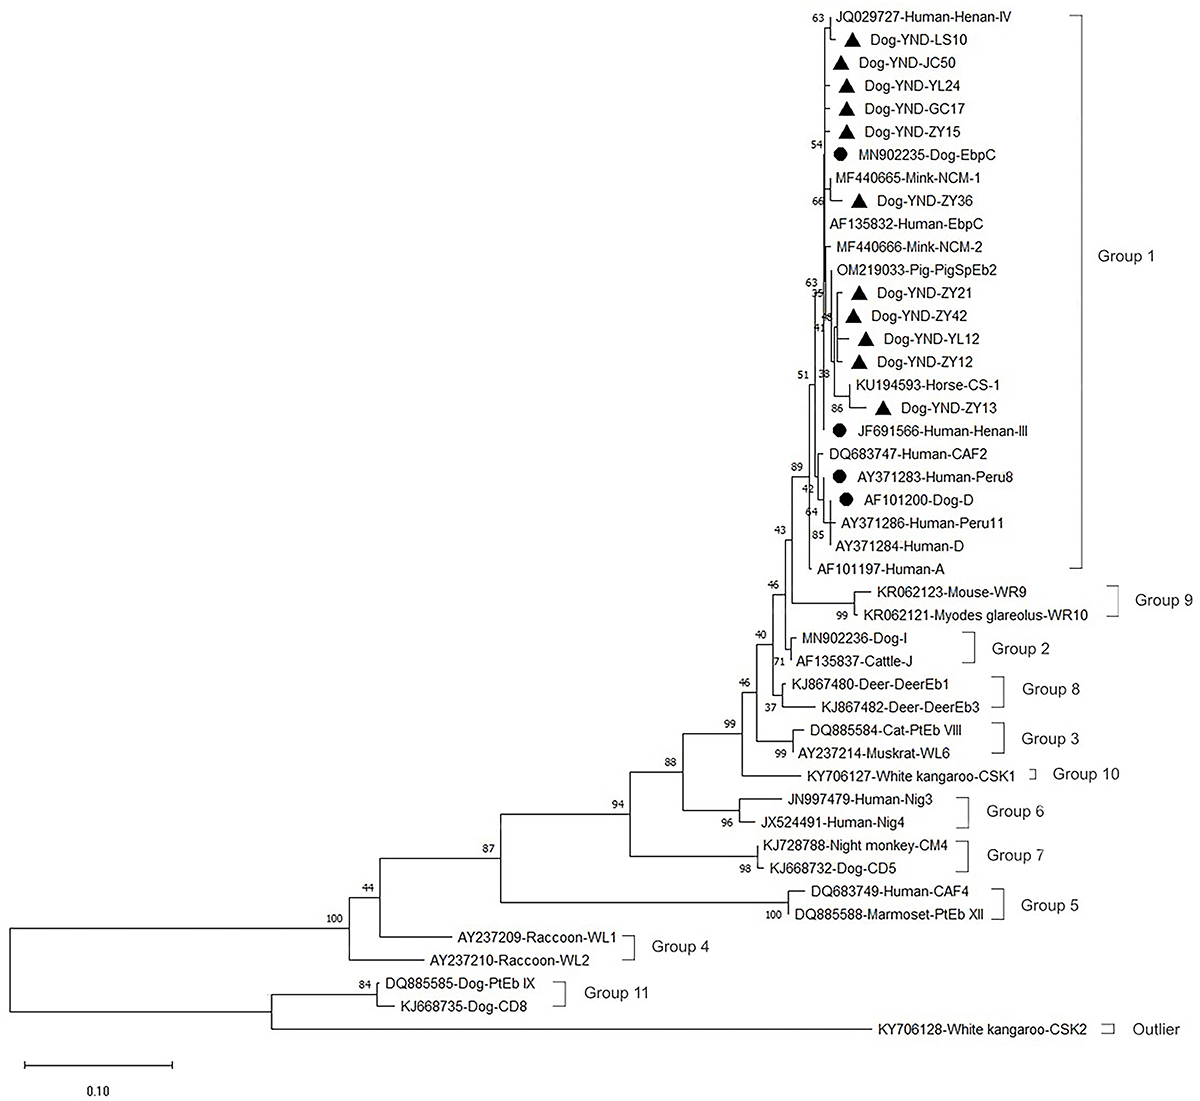
Phylogenetic relationships between genotypes of Enterocytozoon bieneusi identified in this study and known genotypes deposited in GenBank, as inferred by a neighbor-joining analysis of the ITS rRNA gene sequences based on genetic distances calculated by the Kimura-2-parameter model. Numbers on the branches are percent bootstrapping values from 1,000 replicates. Each sequence in this figure is identified by its accession number, host origin, and genotype designation. The group terminology for the clusters is based on the work of Li et al. (2019). Before the genotype names, the circles and triangles filled in black indicate the known and novel genotypes identified in present study, respectively.
Current usage metrics show cumulative count of Article Views (full-text article views including HTML views, PDF and ePub downloads, according to the available data) and Abstracts Views on Vision4Press platform.
Data correspond to usage on the plateform after 2015. The current usage metrics is available 48-96 hours after online publication and is updated daily on week days.
Initial download of the metrics may take a while.