Figure 3
Download original image
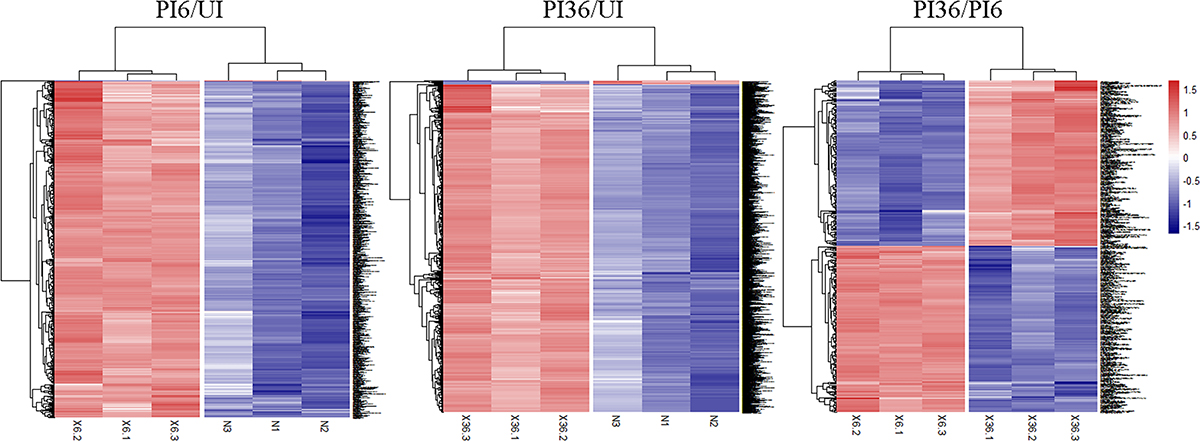
Clustering heatmap of different expression phosphorylated peptides. Each row represents a phosphorylated peptide segment, each column represents a group of samples. The logarithmic value (logarithmic transformation based on 2) of the significantly differentially expressed phosphorylated peptides in different samples is displayed in the clustering heatmap in different colors. Red represents significant up-regulation of phosphorylated peptides; blue represents significant down-regulation of phosphorylated peptides.
Current usage metrics show cumulative count of Article Views (full-text article views including HTML views, PDF and ePub downloads, according to the available data) and Abstracts Views on Vision4Press platform.
Data correspond to usage on the plateform after 2015. The current usage metrics is available 48-96 hours after online publication and is updated daily on week days.
Initial download of the metrics may take a while.