Figure 5

Download original image
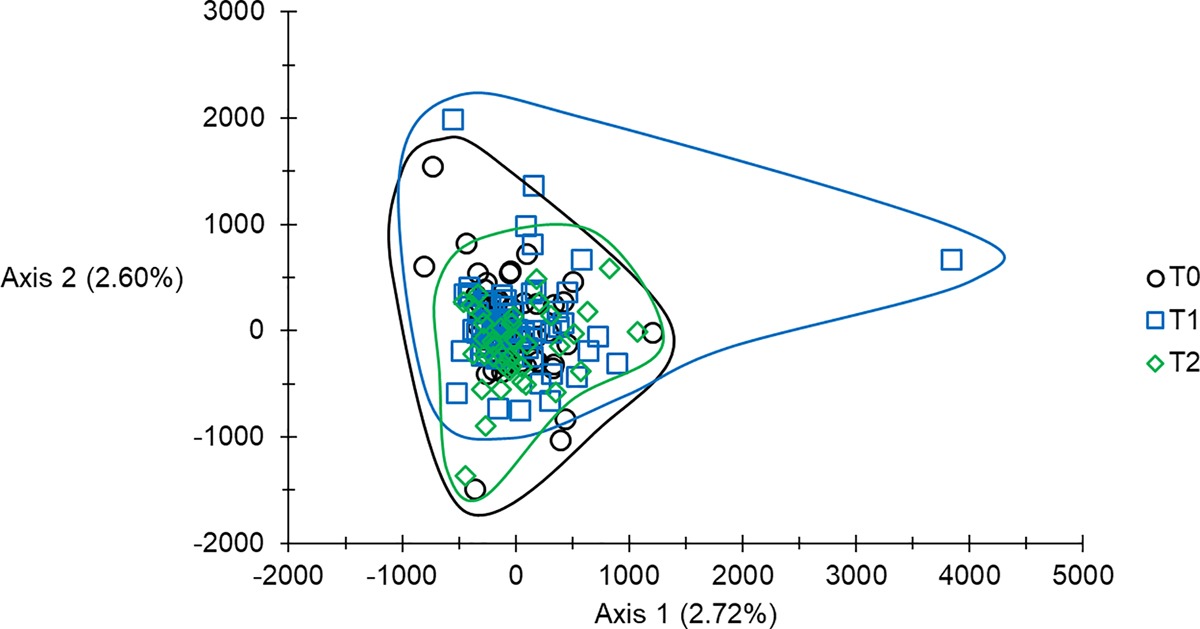
Presentation of the two dimensions projection of individuals of Glossina fuscipes fuscipes from Maro (southern Chad), sampled at different times before and after the beginning of control (T0, T1 and T2), and according to the first two axes of a factorial correspondence analysis. Percent of inertia are indicated. No axis was significant according to the broken stick. Here, data were corrected for stuttering at loci Gff16 and Gff18.
Current usage metrics show cumulative count of Article Views (full-text article views including HTML views, PDF and ePub downloads, according to the available data) and Abstracts Views on Vision4Press platform.
Data correspond to usage on the plateform after 2015. The current usage metrics is available 48-96 hours after online publication and is updated daily on week days.
Initial download of the metrics may take a while.


