Figure 3
Download original image
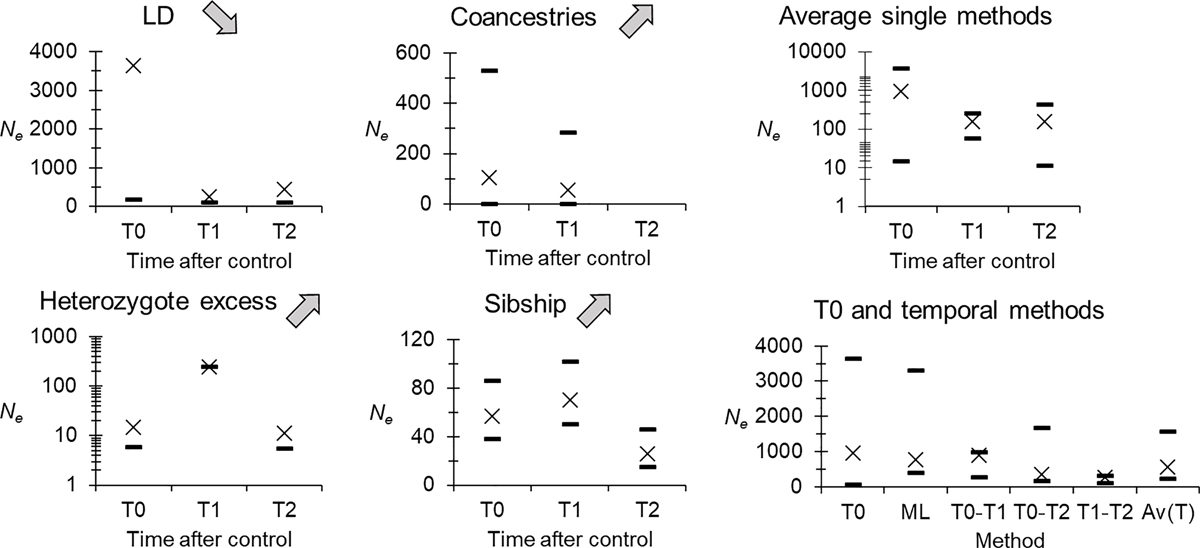
Effective population size (Ne) in Glossina fuscipes fuscipes from the human African trypanosomosis focus of Maro in southern Chad before (T0) and after the beginning of control (T1 and T2), for different methods (crosses). These figures were all computed considering the whole focus as a single population (noted Ne_All in the text). Confidence intervals (dashes), as described in the material and methods section, are 95% confidence intervals, except for average over single methods where dashes correspond to averaged minimum and maximum values. Grey arrows indicate the evolution of Ne after control (increase or decrease) expected in case of a Wahlund effect due to the recolonization by foreign flies, and according to the method used. Absence of crosses or dashes means “infinite”. Here, data were corrected for stuttering at loci Gff16 and Gff18.
Current usage metrics show cumulative count of Article Views (full-text article views including HTML views, PDF and ePub downloads, according to the available data) and Abstracts Views on Vision4Press platform.
Data correspond to usage on the plateform after 2015. The current usage metrics is available 48-96 hours after online publication and is updated daily on week days.
Initial download of the metrics may take a while.