Figure 7
Download original image
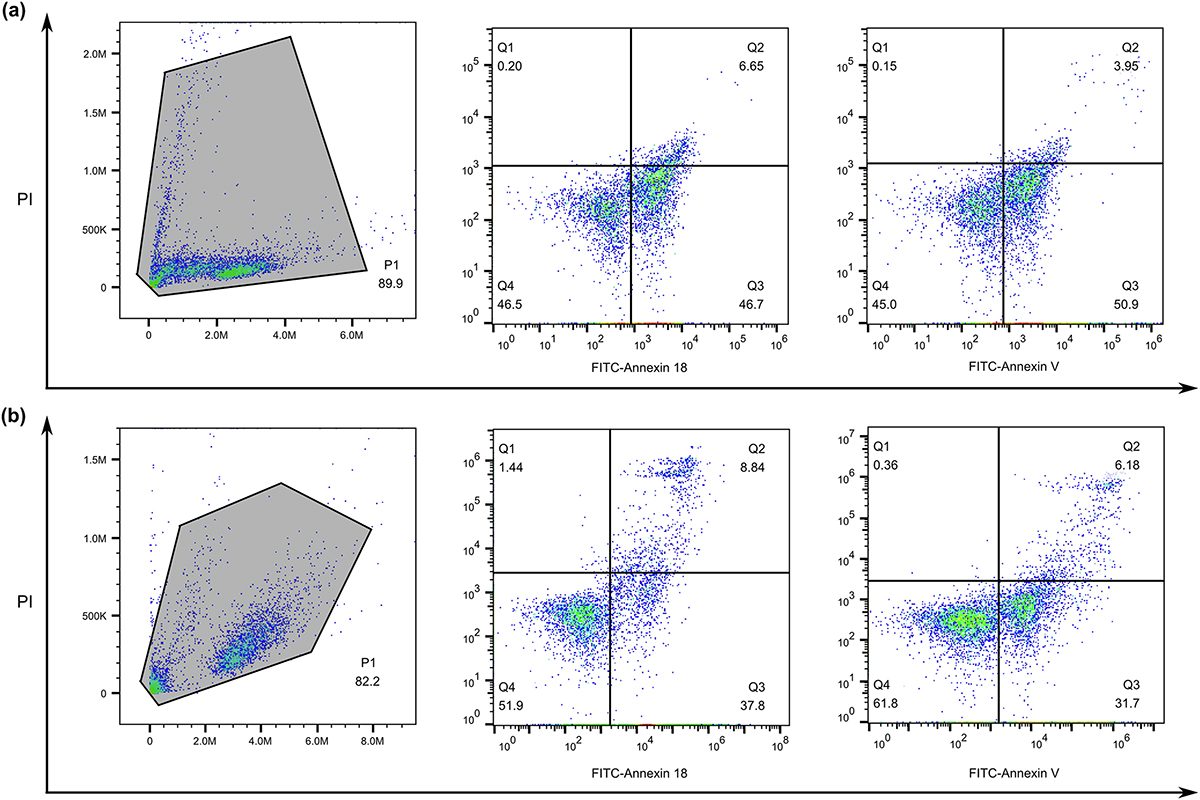
Flow cytometric analysis of SmANX 18 or annexin A5 staining. (a) Representative dot plots of double-stained Jurkat apoptotic cells were assayed by FITC-annexin 18/PI or FITC-annexin A5/PI binding. (b) The double-parameter apoptotic cell scatter diagram of RAW264.7 cells was evaluated by FITC-annexin 18/PI or FITC-annexin A5/PI binding. Ten thousand events were collected for each histogram. The bottom left region of each quadrant (Q4) shows normal living cells, which exclude PI and are negative for FITC-annexin 18 (or A5) binding. The bottom right region (Q3) represents the early apoptotic cells, FITC-annexin 18 (or A5)-positive and PI-negative, demonstrating cytoplasmic membrane integrity. The top right region (Q2) contains necrotic or late apoptotic cells, both positive for FITC-annexin 18 (or A5) binding and PI. The top left region (Q1) may be cell fragments without a cell membrane or dead cells caused by other reasons.
Current usage metrics show cumulative count of Article Views (full-text article views including HTML views, PDF and ePub downloads, according to the available data) and Abstracts Views on Vision4Press platform.
Data correspond to usage on the plateform after 2015. The current usage metrics is available 48-96 hours after online publication and is updated daily on week days.
Initial download of the metrics may take a while.