Figure 2
Download original image
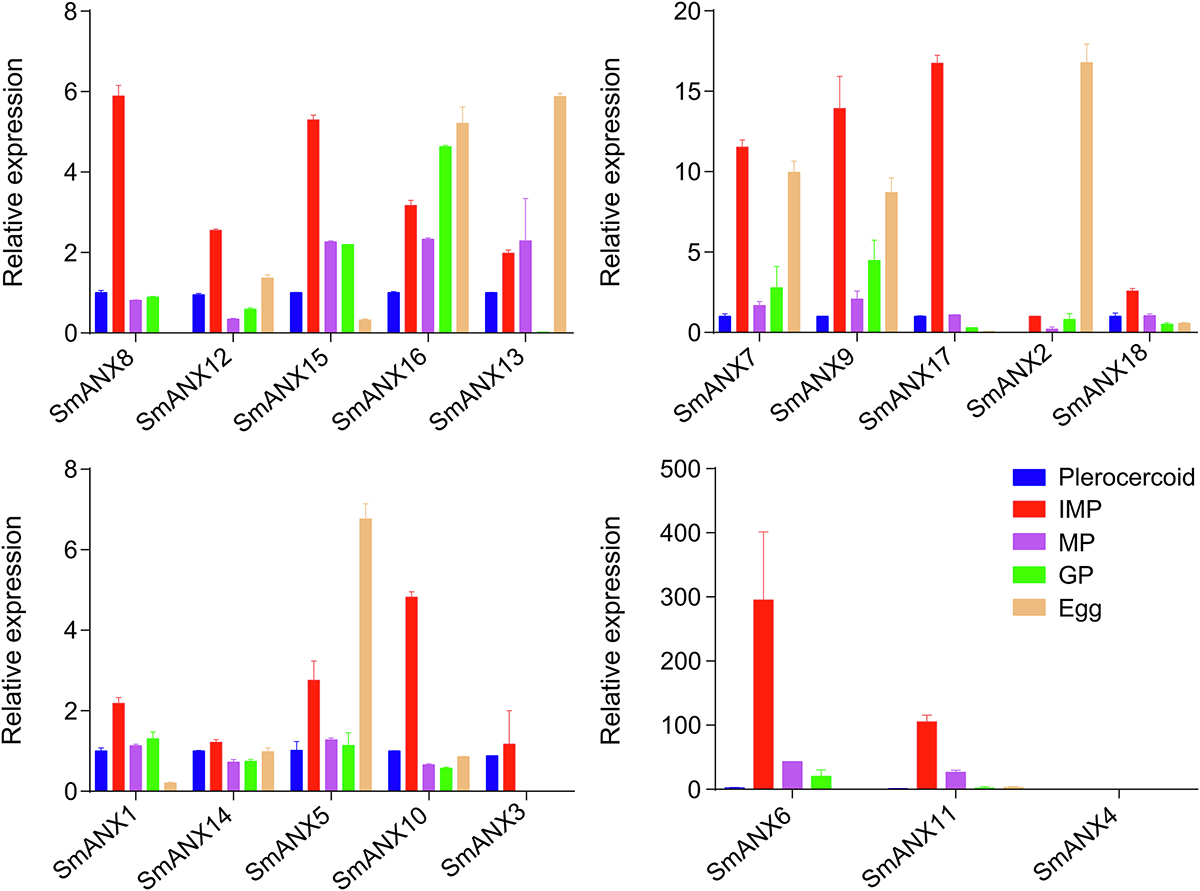
ANX gene expression of S. mansoni in different stages by qRT-PCR. The expression level was normalized to that of GAPDH and measured with the 2−ΔΔCt method. The results were averaged from three independent replicates during all stages. Error bars represent SD (n = 3). IMP, immature proglottid; MP, mature proglottid; GP, gravid proglottid. Blue represents plerocercoid; red represents IMP; purple represents MP; green represents GP; orange represents egg.
Current usage metrics show cumulative count of Article Views (full-text article views including HTML views, PDF and ePub downloads, according to the available data) and Abstracts Views on Vision4Press platform.
Data correspond to usage on the plateform after 2015. The current usage metrics is available 48-96 hours after online publication and is updated daily on week days.
Initial download of the metrics may take a while.