Open Access
Figure 3
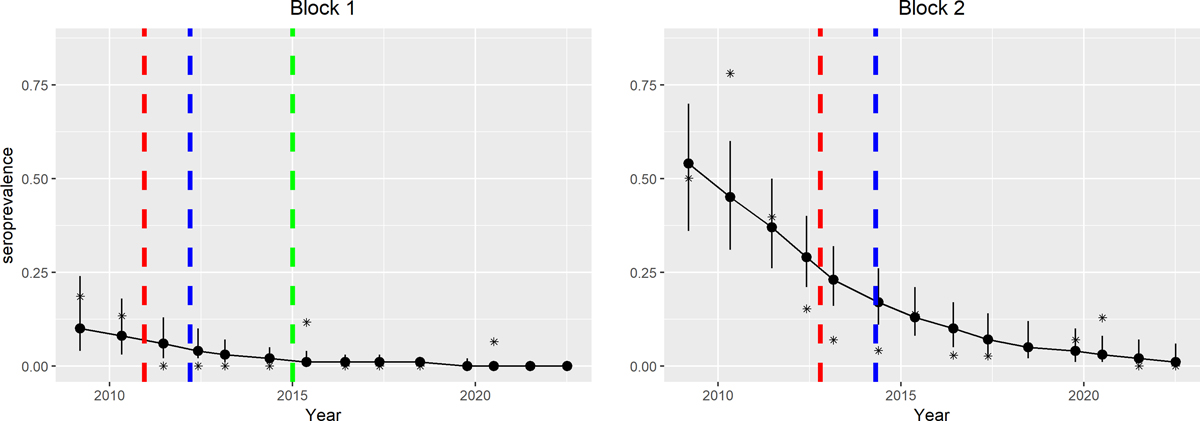
Download original image
Annual seroprevalence predicted by the negative binomial regression model in blocks 1 and 2 during the implementation of the AW-IPM programme, with prediction intervals (red dotted line: start of the suppression phase; blue dotted line: start of the eradication phase; green dotted line: start of the monitoring phase).
Current usage metrics show cumulative count of Article Views (full-text article views including HTML views, PDF and ePub downloads, according to the available data) and Abstracts Views on Vision4Press platform.
Data correspond to usage on the plateform after 2015. The current usage metrics is available 48-96 hours after online publication and is updated daily on week days.
Initial download of the metrics may take a while.