Figure 1
Download original image
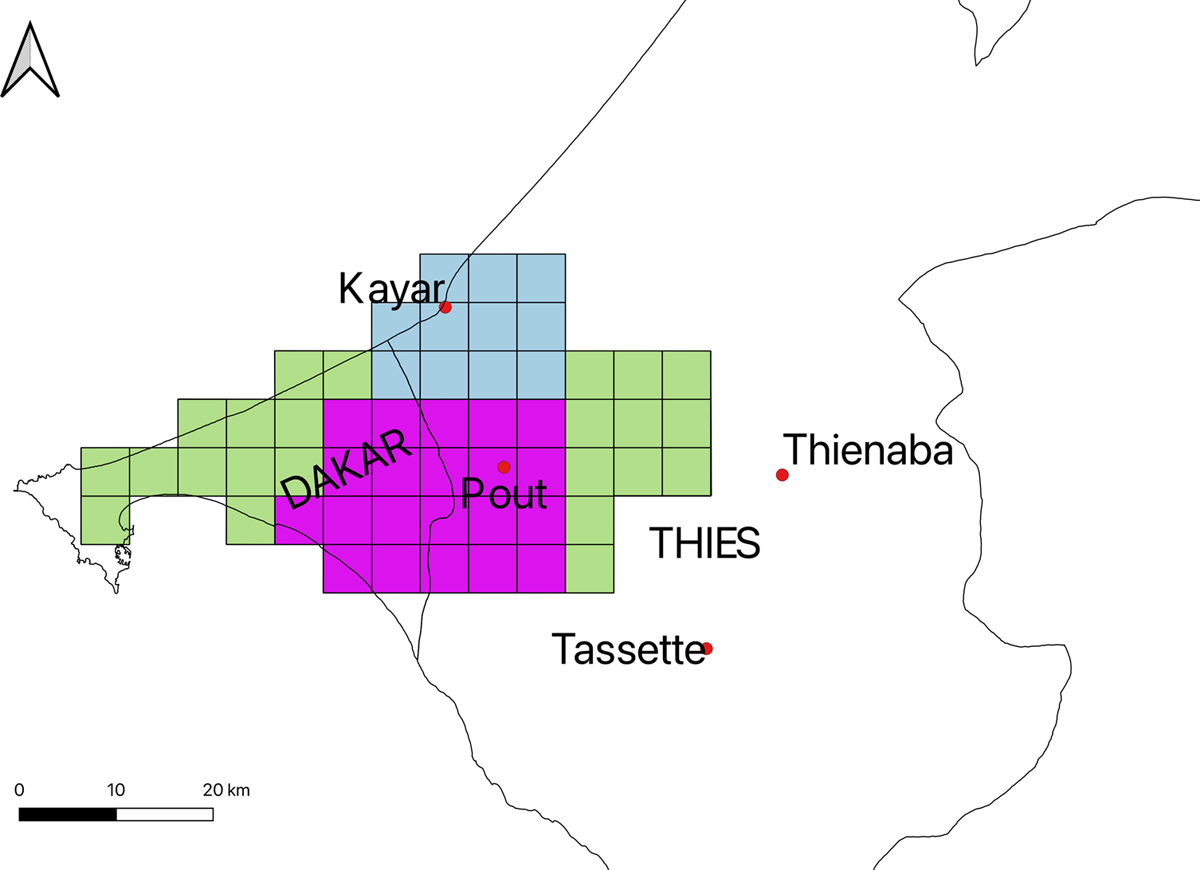
Map of Senegal with the location of the study area: study sites (red dots) and surface covered by block 1 (grid cells in light blue), block 2 (grid cells in purple) and block 3 (grid cells in green). Each grid cell represents an area of 25 square kilometres (5 × 5 km). The map was created using QGIS software v. 2.18.7 (http://www.qgis.org/fr/site/).
Current usage metrics show cumulative count of Article Views (full-text article views including HTML views, PDF and ePub downloads, according to the available data) and Abstracts Views on Vision4Press platform.
Data correspond to usage on the plateform after 2015. The current usage metrics is available 48-96 hours after online publication and is updated daily on week days.
Initial download of the metrics may take a while.