Figure 5
Download original image
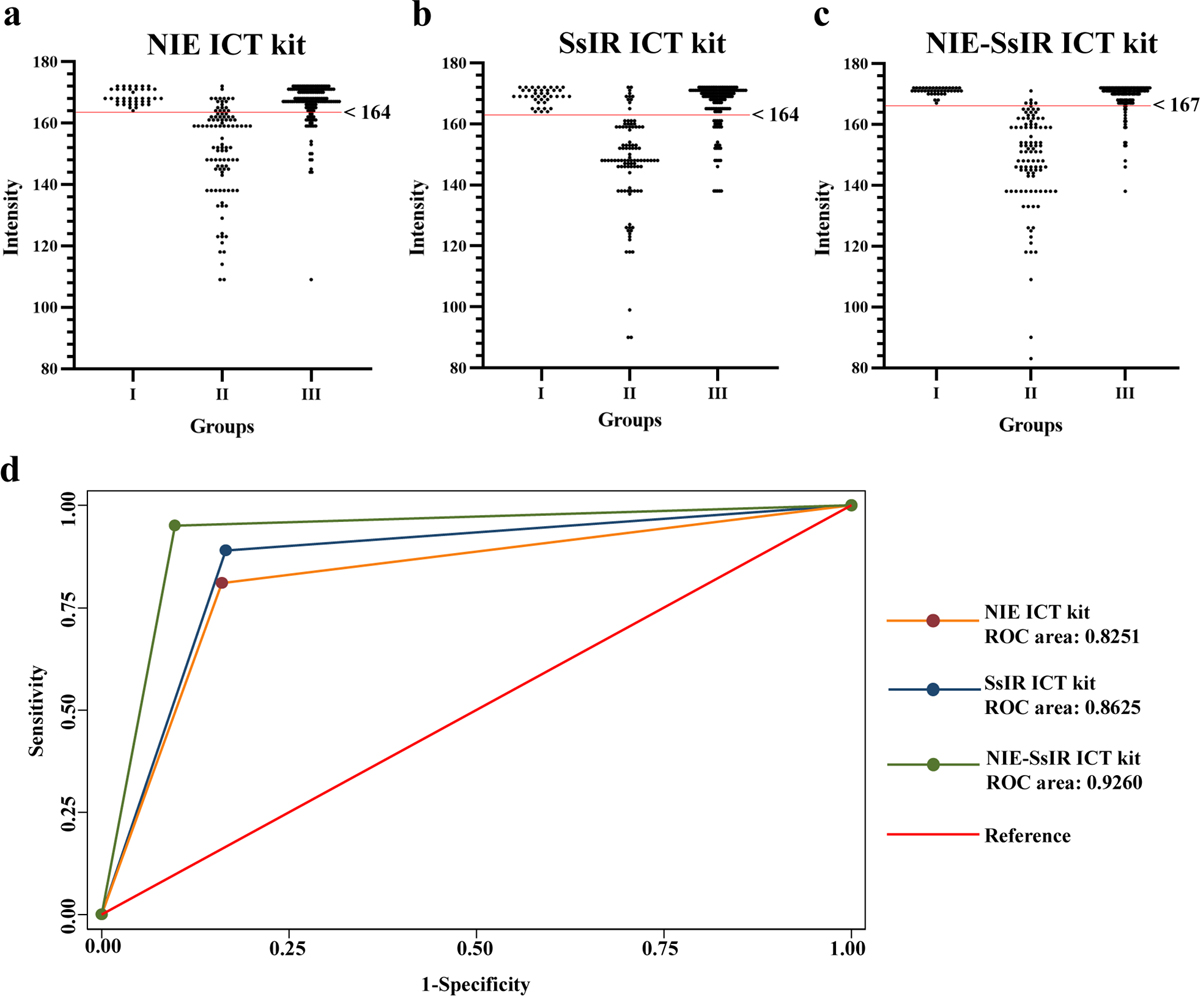
The intensity values of NIE (a), SsIR (b), and NIE-SsIR (c) ICT kits were evaluated using an in-house strip reader (red line indicates cut-off intensity value). Groups I, II, and III represented healthy controls, proven strongyloidiasis, and other parasitic infections, respectively. Any value above the cut-off value (red horizontal lines) is negative. Receiver operator characteristic (ROC) area analyses of the NIE, SsIR, and NIE-SsIR ICT kits to compare accuracy of all kits with gold standard methods (d).
Current usage metrics show cumulative count of Article Views (full-text article views including HTML views, PDF and ePub downloads, according to the available data) and Abstracts Views on Vision4Press platform.
Data correspond to usage on the plateform after 2015. The current usage metrics is available 48-96 hours after online publication and is updated daily on week days.
Initial download of the metrics may take a while.