Figure 2
Download original image
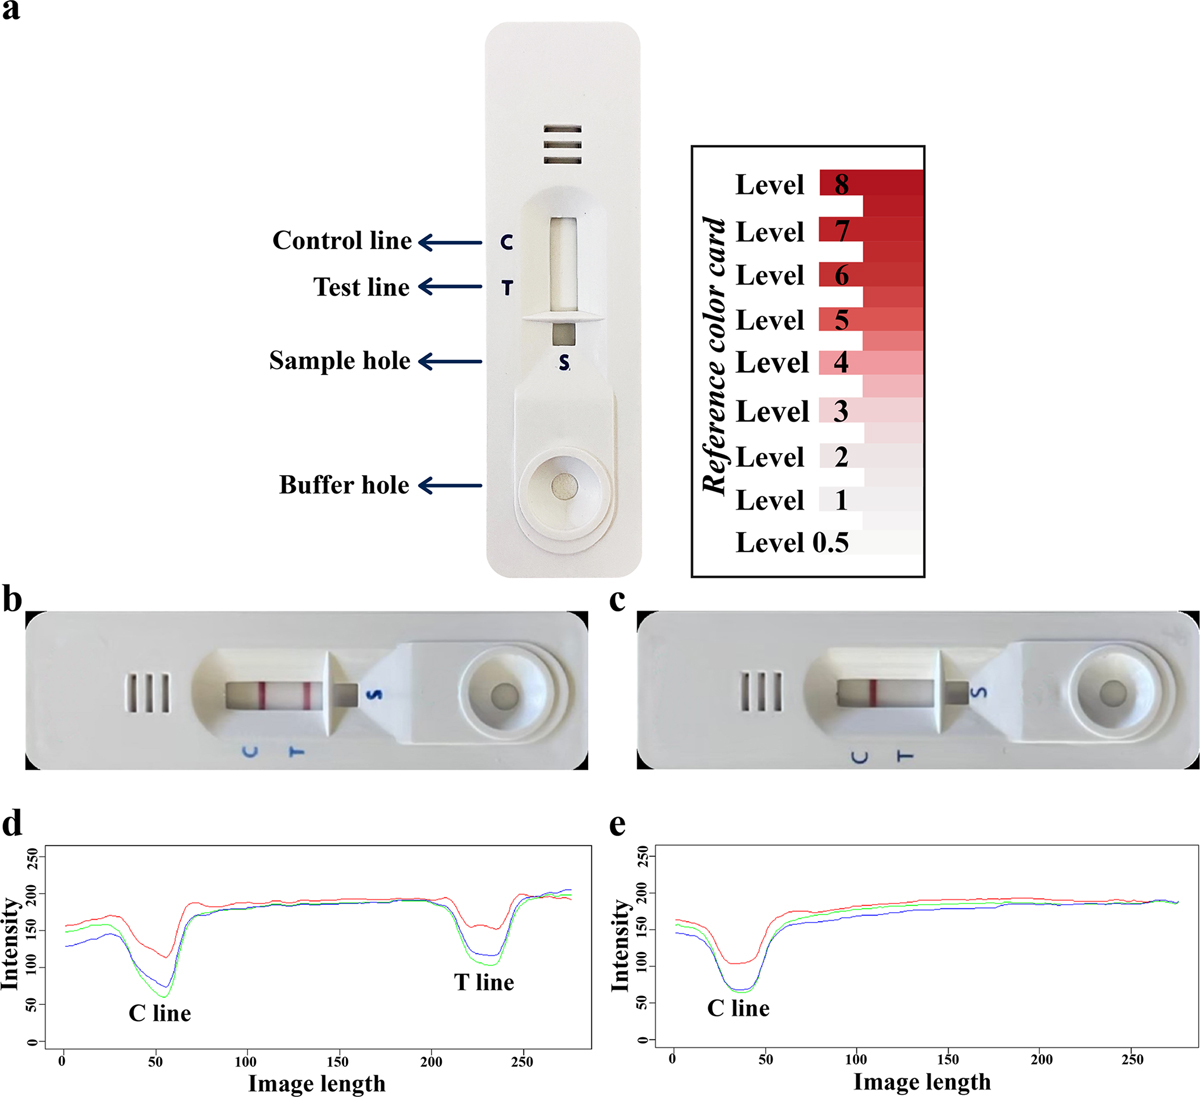
The parts of an ICT kit (left) and reference colour card (right) (a). An ICT kit showing a positive result (b) with a band at both control (C) and test (T) lines. An ICT kit showing a negative result (c) with a band only at the C line. The intensity value of the colour image is specified by the red, green, and blue parameters as separate integers from 0 to 255 with the 8-bit representation of a pixel in the image. The intensity values were plotted for C and T lines of the positive (d) and negative (e) ICT kits. The intensity values (d and e) were related to colour band intensity of C and T lines in the strips. S indicates sample hole.
Current usage metrics show cumulative count of Article Views (full-text article views including HTML views, PDF and ePub downloads, according to the available data) and Abstracts Views on Vision4Press platform.
Data correspond to usage on the plateform after 2015. The current usage metrics is available 48-96 hours after online publication and is updated daily on week days.
Initial download of the metrics may take a while.