Figure 3
Download original image
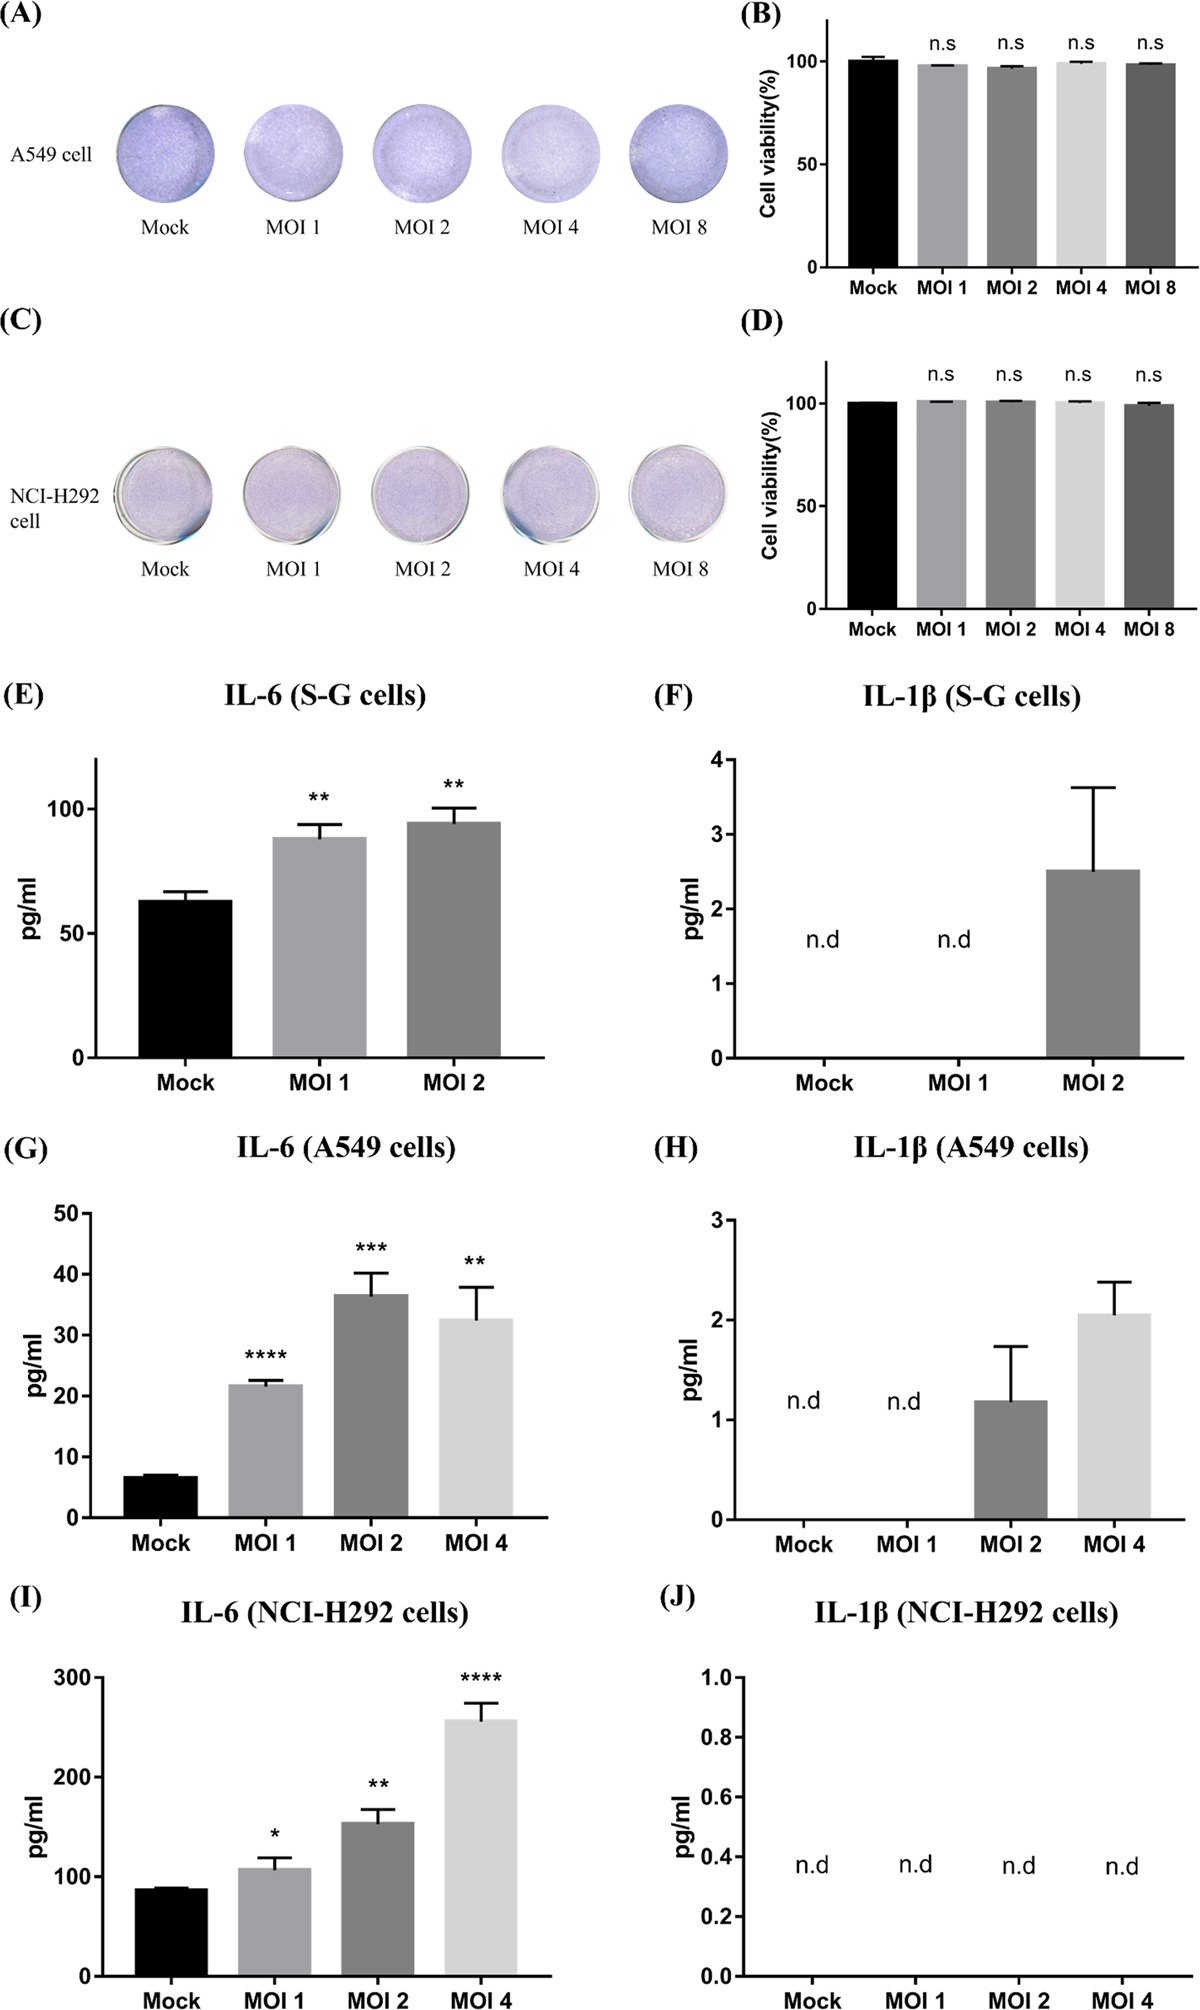
Cytopathic effect and cytokine production of S-G, A549, and NCI-H292 cells after stimulation by Trichomonas tenax. A549 (A, B) and NCI-H292 cells (C, D) were co-incubated with T. tenax for 24 h, the attached cells were then stained with Giemsa buffer and the percentage of stained cells was calculated by ImageJ. S-G (E, F), A549 (G, H) and NCI-H292 (I, J) cells were treated with T. tenax at different MOIs for 24 h, and the concentration of IL-6 and IL-1β were detected by ELISA (n.d: not detection, n.s: not significant, **p ≤ 0.01, ***p ≤ 0.001, ****p ≤ 0.0001, MOI: multiplicity of infection).
Current usage metrics show cumulative count of Article Views (full-text article views including HTML views, PDF and ePub downloads, according to the available data) and Abstracts Views on Vision4Press platform.
Data correspond to usage on the plateform after 2015. The current usage metrics is available 48-96 hours after online publication and is updated daily on week days.
Initial download of the metrics may take a while.