Figure 2
Download original image
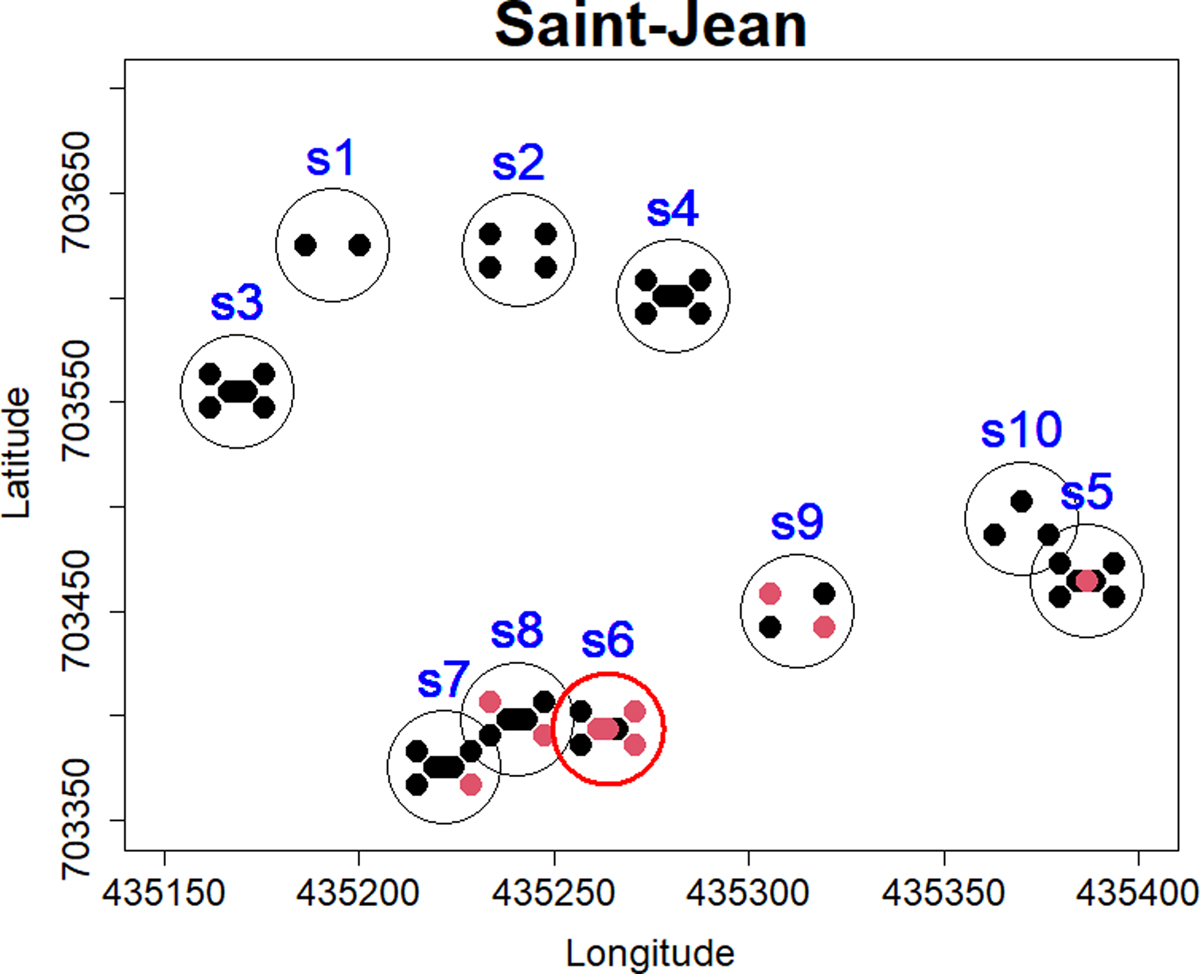
Spatial clustering of T. gondii-infected small mammals of Cotonou. Each black circle corresponds to a sampled site graphically represented by its GPS coordinates. Red and black dots represent T. gondii-infected and T. gondii-uninfected animals, respectively. Red circles represent significant clusters of cases based on the spatial statistic scan.
Current usage metrics show cumulative count of Article Views (full-text article views including HTML views, PDF and ePub downloads, according to the available data) and Abstracts Views on Vision4Press platform.
Data correspond to usage on the plateform after 2015. The current usage metrics is available 48-96 hours after online publication and is updated daily on week days.
Initial download of the metrics may take a while.