Figure 3
Download original image
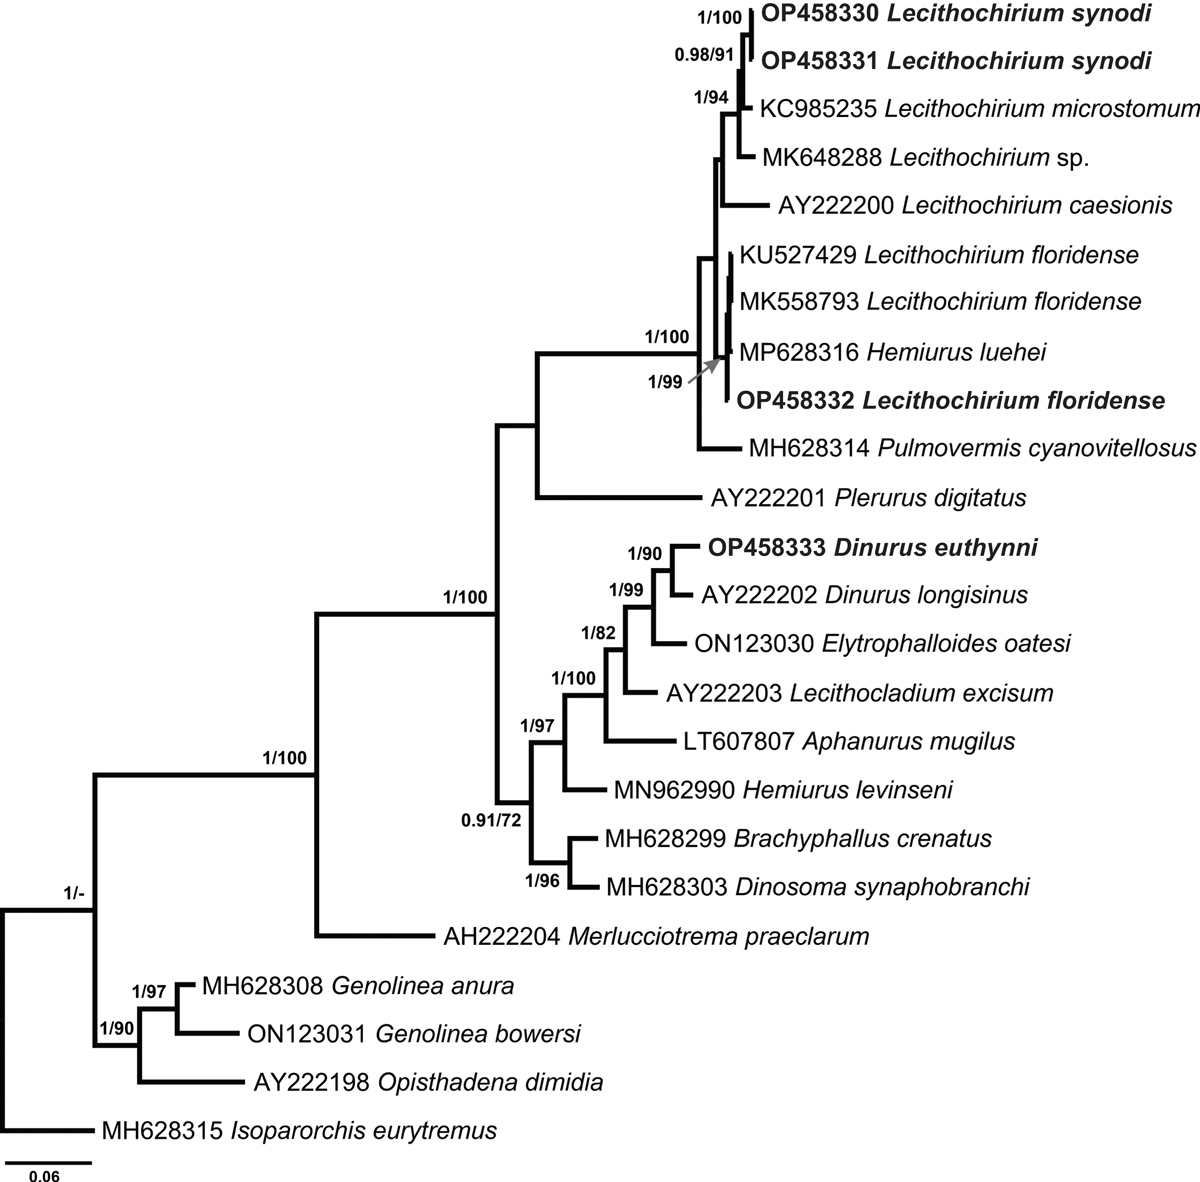
Phylogram from Bayesian inference (BI) analysis based on the 28S rDNA sequences of the Hemiuridae. Nodal support values are given as BI/ML (maximum likelihood). Support values lower than 0.90 (BI) and 70 (ML) are not shown. The scale-bar indicates the expected number of substitutions per site. Newly generated sequences are highlighted in bold.
Current usage metrics show cumulative count of Article Views (full-text article views including HTML views, PDF and ePub downloads, according to the available data) and Abstracts Views on Vision4Press platform.
Data correspond to usage on the plateform after 2015. The current usage metrics is available 48-96 hours after online publication and is updated daily on week days.
Initial download of the metrics may take a while.