Figure 5
Download original image
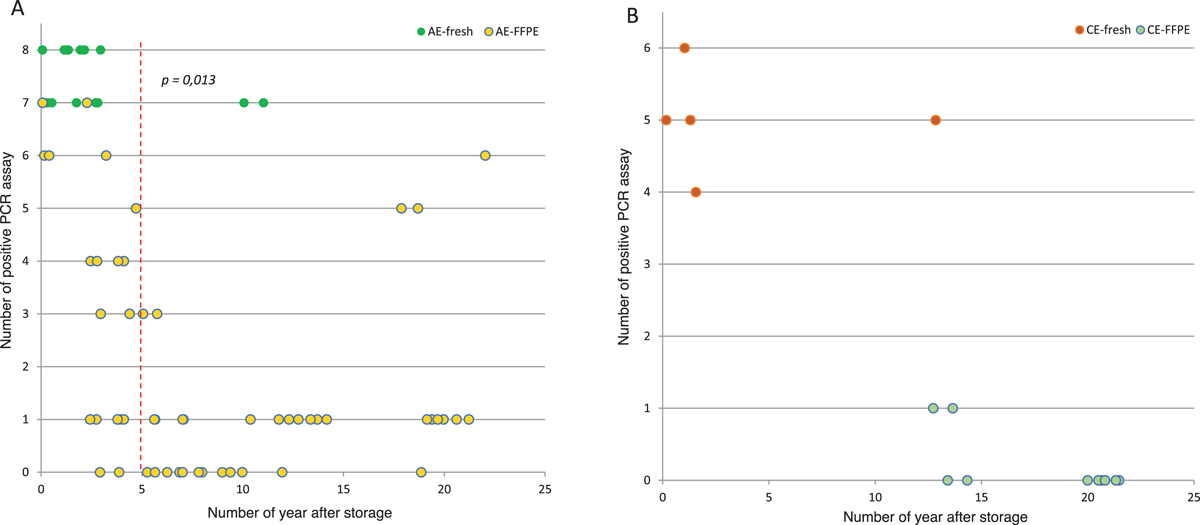
Number of positive PCR assays according to the time between starting point of the storage and DNA extraction and the type of sampling (fresh versus FFPE) and Echinococcus species. (A) The green and yellow dots represent fresh and FFPE AE samples, respectively. The dashed red line indicates for the FFPE samples when a significant difference in terms of positive PCR assays is found between the samples stored less than 5 years and more than 5 years. (B) The orange and light blue dots represent fresh and FFPE CE samples, respectively.
Current usage metrics show cumulative count of Article Views (full-text article views including HTML views, PDF and ePub downloads, according to the available data) and Abstracts Views on Vision4Press platform.
Data correspond to usage on the plateform after 2015. The current usage metrics is available 48-96 hours after online publication and is updated daily on week days.
Initial download of the metrics may take a while.