Open Access
Supplementary Fig. S2:
Download original image
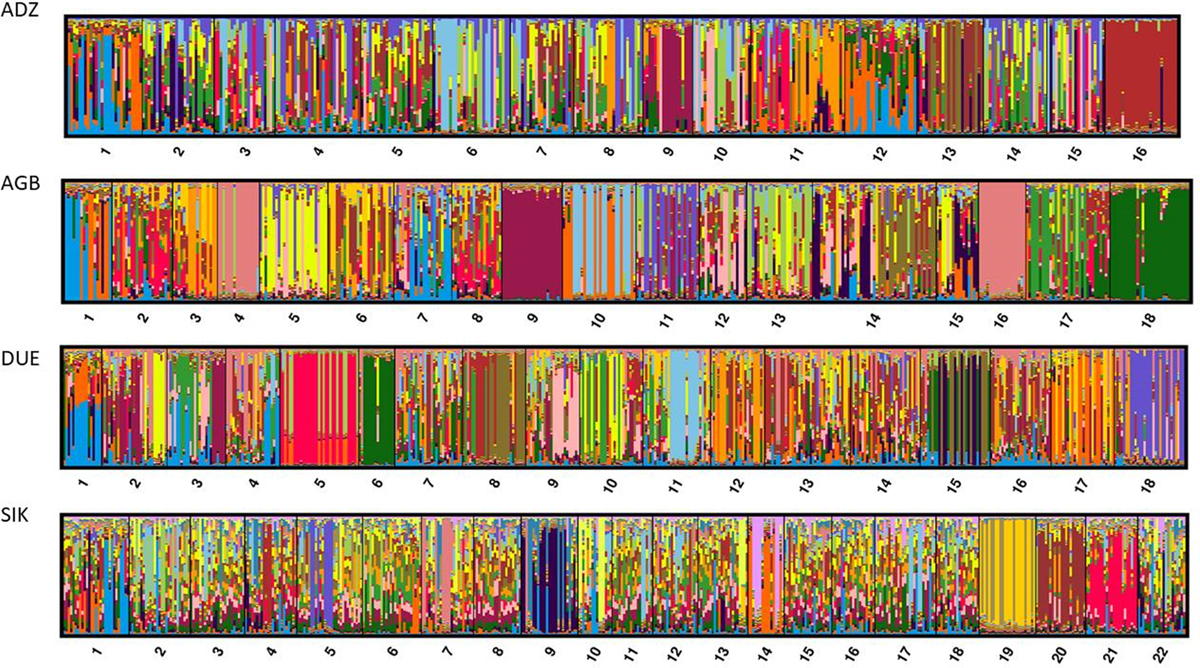
Bar plots depicting the percentage for each miracidium belonging to each cluster by child, using children hosting at least 15 miracidia in Adzopé (ADZ), Agboville (AGB), Duekoué (DUE), and Sikensi (SIK). This was done in Structure and each site K was set equal to the number of children.
Current usage metrics show cumulative count of Article Views (full-text article views including HTML views, PDF and ePub downloads, according to the available data) and Abstracts Views on Vision4Press platform.
Data correspond to usage on the plateform after 2015. The current usage metrics is available 48-96 hours after online publication and is updated daily on week days.
Initial download of the metrics may take a while.