Figure 2

Download original image
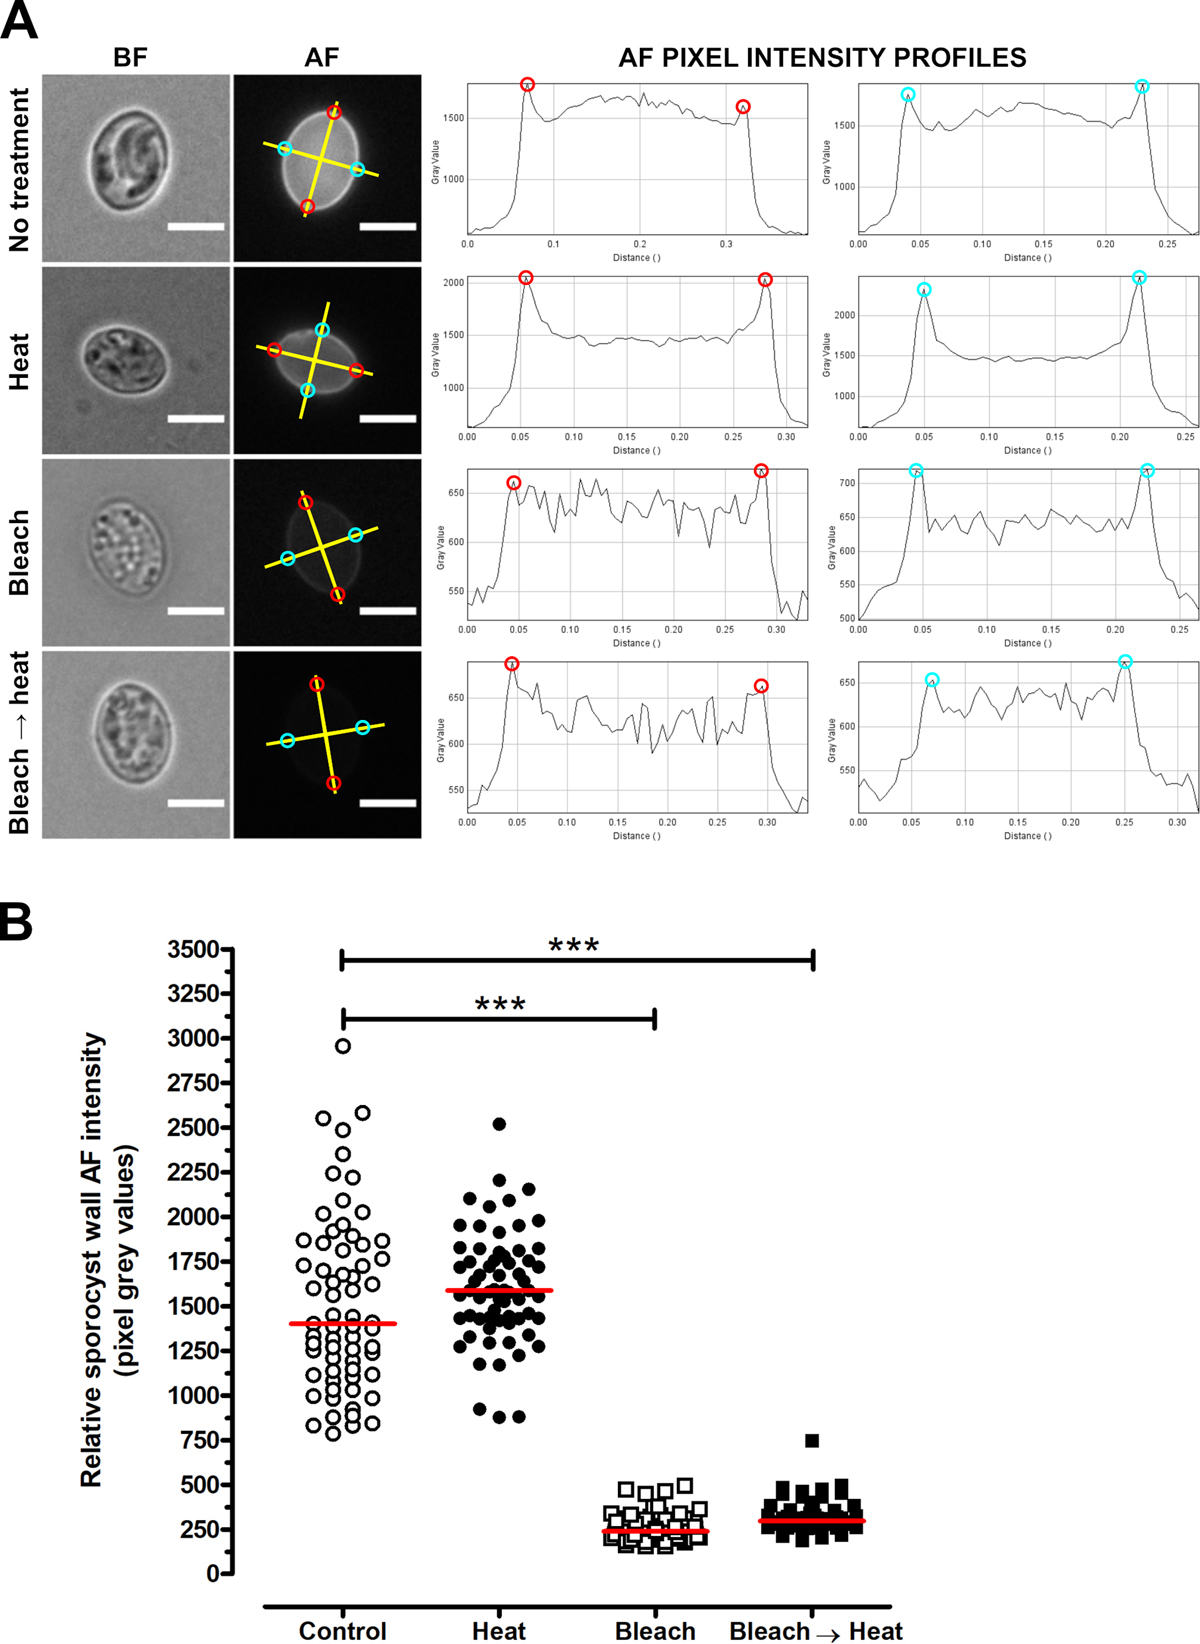
Autofluorescence (AF) wall properties of untreated, bleached and/or heated free Toxoplasma gondii sporocysts. (A) Relative AF intensity was quantified by recording pixel grey values along two straight lines (in yellow) arbitrarily set up across the length and width of each sporocyst. The corresponding plot profiles were generated on ImageJ to determine pixel grey values at the intercepts with the sporocyst wall (red and cyan circles). Following normalisation with regard to background grey value of each image, a mean pixel grey value was calculated for each sporocyst and then plotted as a function of parasite treatment condition using Graph Pad Prism 5.03 software. (B) Distribution of the relative AF intensity of the sporocyst wall as a function of treatment. The red line is the median of the distribution (n = 65 sporocysts analysed per condition). ***p < 0.001 (Kruskal–Wallis test).
Current usage metrics show cumulative count of Article Views (full-text article views including HTML views, PDF and ePub downloads, according to the available data) and Abstracts Views on Vision4Press platform.
Data correspond to usage on the plateform after 2015. The current usage metrics is available 48-96 hours after online publication and is updated daily on week days.
Initial download of the metrics may take a while.


