Figure 2
Download original image
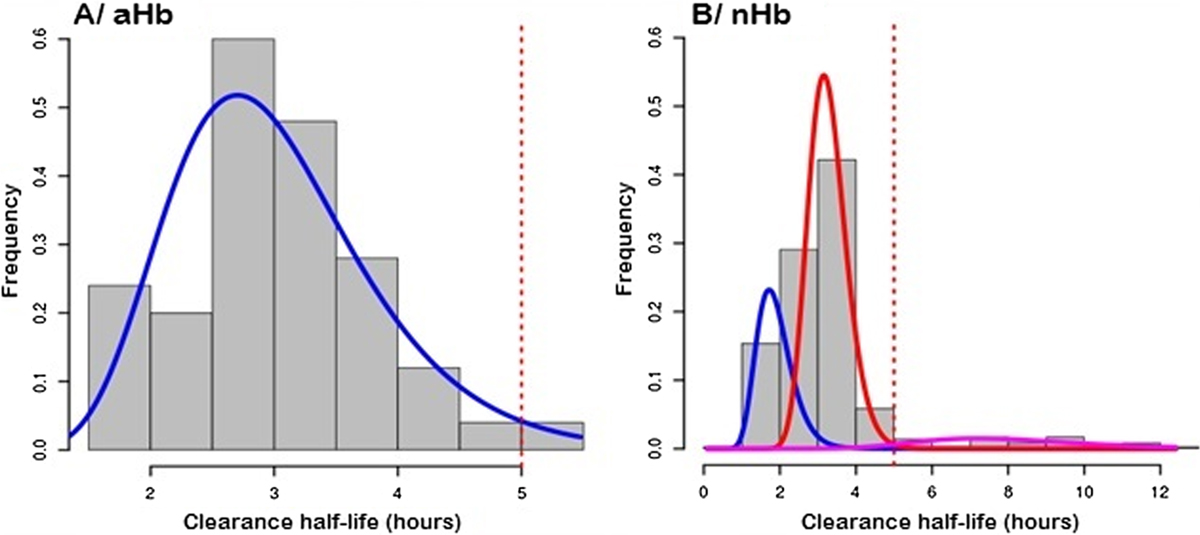
Modeling the population parasite number according to the hemoglobin type. The parasite half-life time is plotted for those with (A) or without (B) abnormal hemoglobin according to the White et al. [27], distribution model. For aHb, the model describes only one phenotype (half-life time = 2.15 ± 1.37 h), whereas for nHb, three phenotypes were found: i) phenotype 1 (blue line, half-life time = 1.83 ± 1.28 h) accounting for 25.4% of the patients, ii) phenotype 2 (red line, half-life time = 3.23 ± 1.17 h) accounting for 66.88% of the patients, and iii) phenotype 3 (pink line, half-life time = 7.78 ± 1.32 h) accounting for 7.73%. The red line highlights the threshold of potential resistance (half-life more than > 5 h). aHb (Abnormal hemoglobin), nHb (Normal hemoglobin).
Current usage metrics show cumulative count of Article Views (full-text article views including HTML views, PDF and ePub downloads, according to the available data) and Abstracts Views on Vision4Press platform.
Data correspond to usage on the plateform after 2015. The current usage metrics is available 48-96 hours after online publication and is updated daily on week days.
Initial download of the metrics may take a while.