Figure 6

Download original image
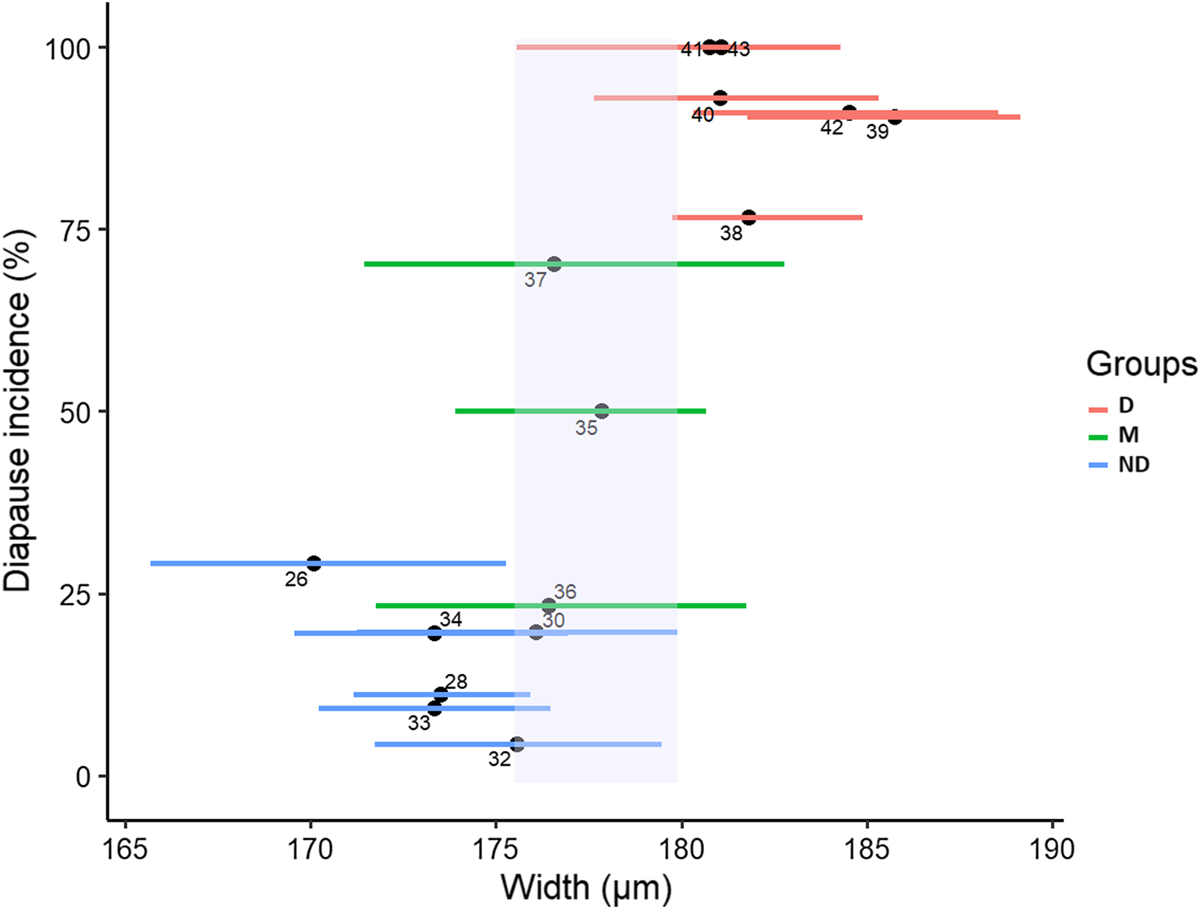
Association between the width of the eggs and diapause incidence. Data come from 2019 and the Reichstett field area. Eggs are batched according to the calendar week of collection. For each week, average diapause incidence is used. Width of eggs is shown as dots for median values and lines as interquartile ranges. Three groups are defined depending on their week of collection: group ND from weeks 26 to 34 (in blue), group M from 35 to 37 (in green) and group D from 38 to 43 (in red). An overlap in width between group ND and D is highlighted in pale lavender.
Current usage metrics show cumulative count of Article Views (full-text article views including HTML views, PDF and ePub downloads, according to the available data) and Abstracts Views on Vision4Press platform.
Data correspond to usage on the plateform after 2015. The current usage metrics is available 48-96 hours after online publication and is updated daily on week days.
Initial download of the metrics may take a while.


