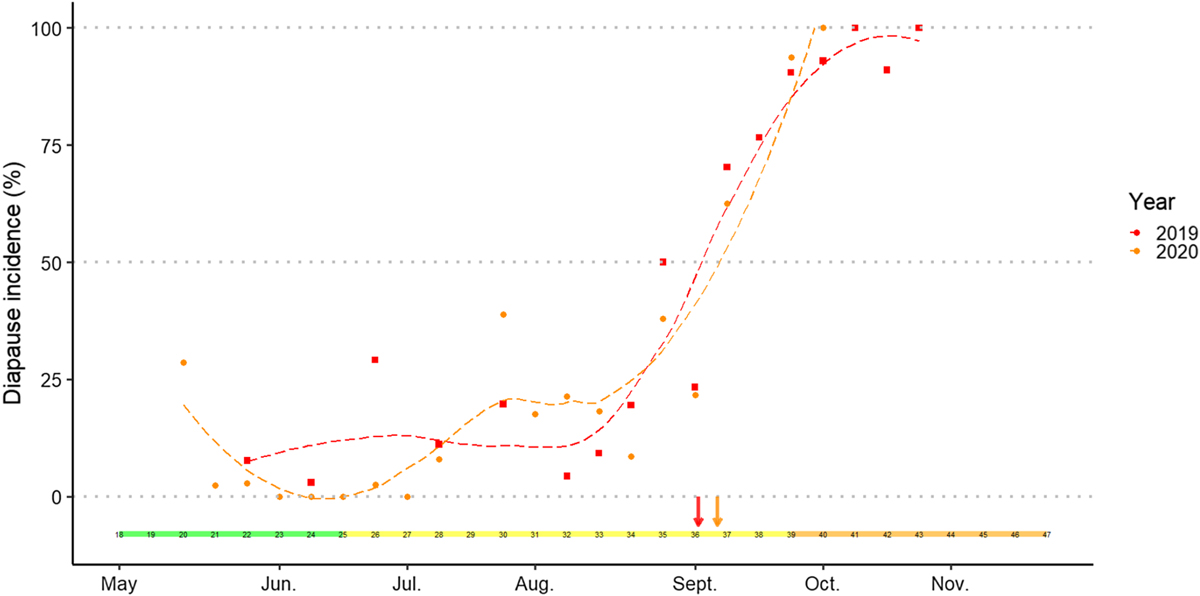
Figure 4

Download original image
Diapause incidence in Ae. japonicus eggs. Mean diapause incidence per week observed from eggs collected in the Reichstett field area. Data for 2019 are shown in empty red triangles while data for 2020 are shown in full orange triangles. Diapause incidence is achieved after hatching tests and bleaching treatment. The curve with dashed lines is the tendency of diapause incidence. A 50% diapause incidence observed in eggs, in dotted grey line, is achieved at week 36 for 2019 (red arrow) and week 37 for 2020 (orange arrow). Corresponding months and seasons are also shown in the coloured horizontal bar (green = spring, yellow = summer, orange = autumn).
Current usage metrics show cumulative count of Article Views (full-text article views including HTML views, PDF and ePub downloads, according to the available data) and Abstracts Views on Vision4Press platform.
Data correspond to usage on the plateform after 2015. The current usage metrics is available 48-96 hours after online publication and is updated daily on week days.
Initial download of the metrics may take a while.


