Figure 2
Download original image
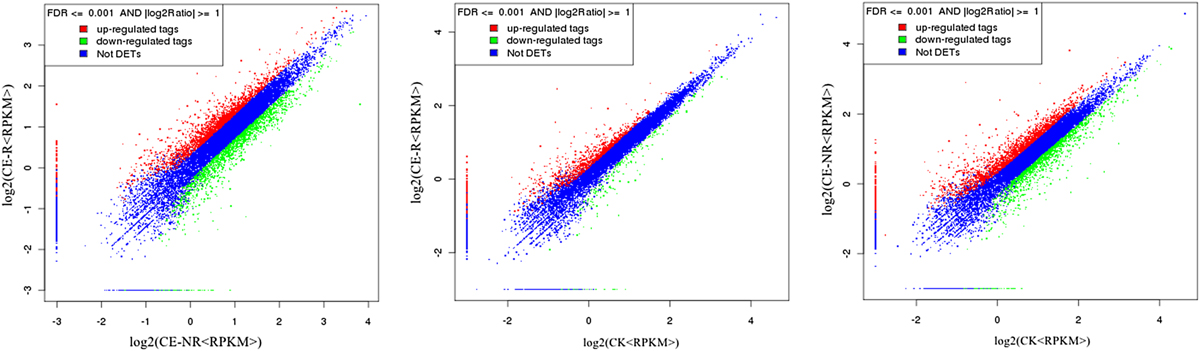
Scatter chart of differential expression genes between groups. Figure 2A shows differential expression genes between the CE-R and CE-NR groups. Figure 2B shows differential expression genes between the CE-R and CK groups. Figure 2C shows differential expression genes between the CE-NR and CK groups. X-axis and Y-axis presents two samples log2 value of gene expression, and the expression was calculated using the RPKM method (reads per kilobase transcriptome per million mapped reads) as shown in section “Materials and methods”, red (up) and green (down) dots mean the gene has significant differences (FDR ≤ 0.001, two fold difference), and the blue dot means no significant differences.
Current usage metrics show cumulative count of Article Views (full-text article views including HTML views, PDF and ePub downloads, according to the available data) and Abstracts Views on Vision4Press platform.
Data correspond to usage on the plateform after 2015. The current usage metrics is available 48-96 hours after online publication and is updated daily on week days.
Initial download of the metrics may take a while.