Figure 1
Download original image
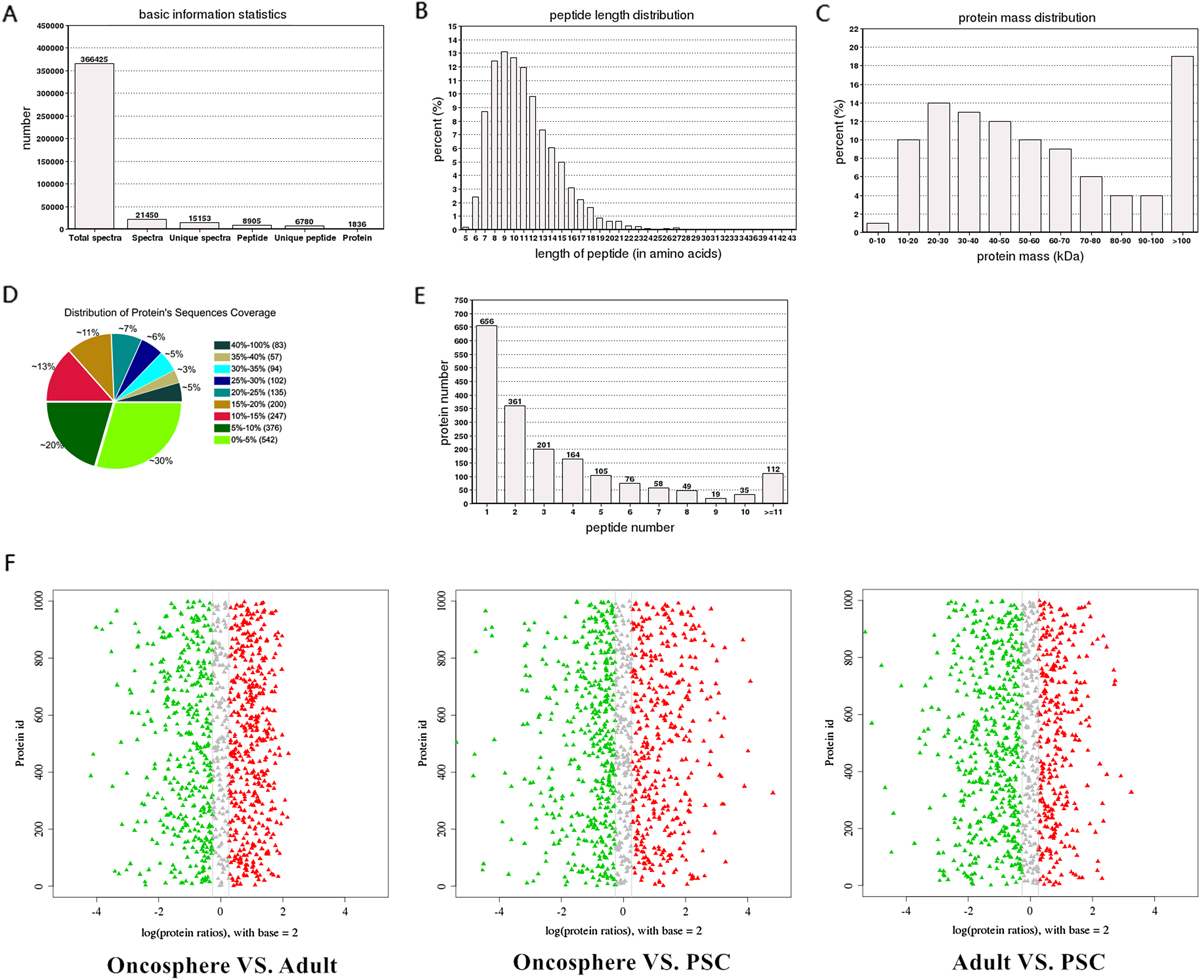
Basic information of protein characterization in Echinococcus granulosus. A. The identification of basic information of peptides of Echinococcus granulosus. The x-axis is the identification category, and the y-axis the quantity. Total spectra is the total number of secondary spectra, spectra is the number of matched spectra, unique spectra is the number of spectra matched to a unique peptide, peptide is the number of peptides identified, and unique peptide is the number of unique peptide sequences identified. Protein is the number of proteins identified. B. Peptide length distribution of Echinococcus granulosus. The x-axis is the number of amino acid residues in the peptide, and the y-axis the percentage of peptides of this length in all peptides. C. Proteins mass distribution of Echinococcus granulosus. The x-axis is the molecular mass of the identified protein (unit: kilodalton, kDa), and the y-axis the number of the identified protein. D. Distribution of protein sequence coverage of Echinococcus granulosus. Different colors represent different protein sequence coverage ranges, and the percentage of the pie chart shows the ratio of the number of proteins in different coverage ranges to the total number of proteins. E. Peptide number distribution of Echinococcus granulosus. The x-axis is the range of the number of peptides identified in the protein, and the y-axis is the number of proteins. F. Abundance of differentially expressed proteins between groups. The x-axis represents the value of the difference multiple after logarithm conversion with 2 as the base. Values greater than 0 are up-regulated, and those less than 0 are down-regulated. Among them, points with a multiple of difference greater than 1.2 are marked with red and green (red is increase in expression, and green is decrease in expression).
Current usage metrics show cumulative count of Article Views (full-text article views including HTML views, PDF and ePub downloads, according to the available data) and Abstracts Views on Vision4Press platform.
Data correspond to usage on the plateform after 2015. The current usage metrics is available 48-96 hours after online publication and is updated daily on week days.
Initial download of the metrics may take a while.