Figure 3

Download original image
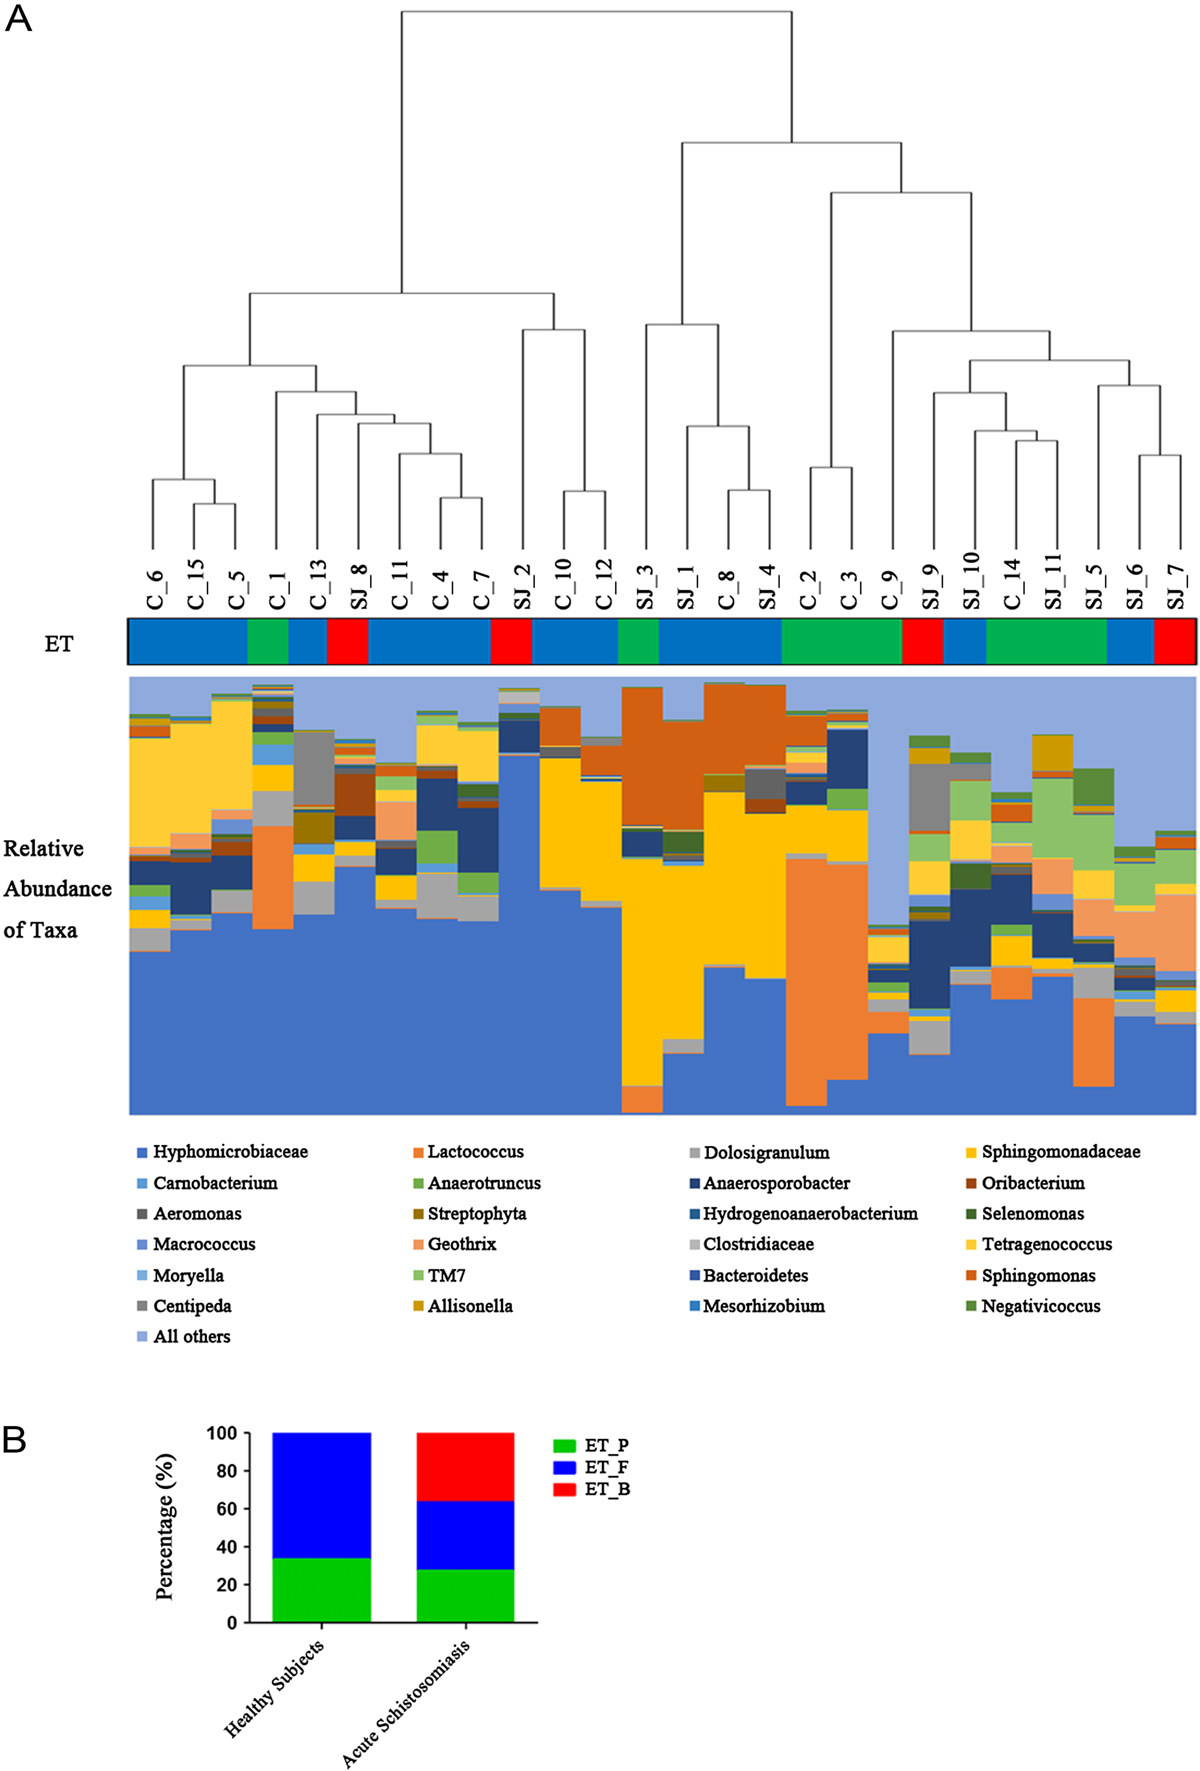
Bar chart showing the composition of the relative abundant bacterial groups and enterotype of each subject at the genus level. (A) Relative abundant bacterial of taxa in each subject according to the Euclidean distance metric and “Complete” linkage of cluster. (B) distribution of healthy subjects and acute schistosomiasis patients over three enterotypes: Prevotella (ET_P, n = 8), Firmicutes (ET_F, n = 14), and Bacteroides (ET_B, n = 4). Chi-square test for independence: n = 26, χ2 = 6.61, p = 0.037.
Current usage metrics show cumulative count of Article Views (full-text article views including HTML views, PDF and ePub downloads, according to the available data) and Abstracts Views on Vision4Press platform.
Data correspond to usage on the plateform after 2015. The current usage metrics is available 48-96 hours after online publication and is updated daily on week days.
Initial download of the metrics may take a while.


