Figure 1
Download original image
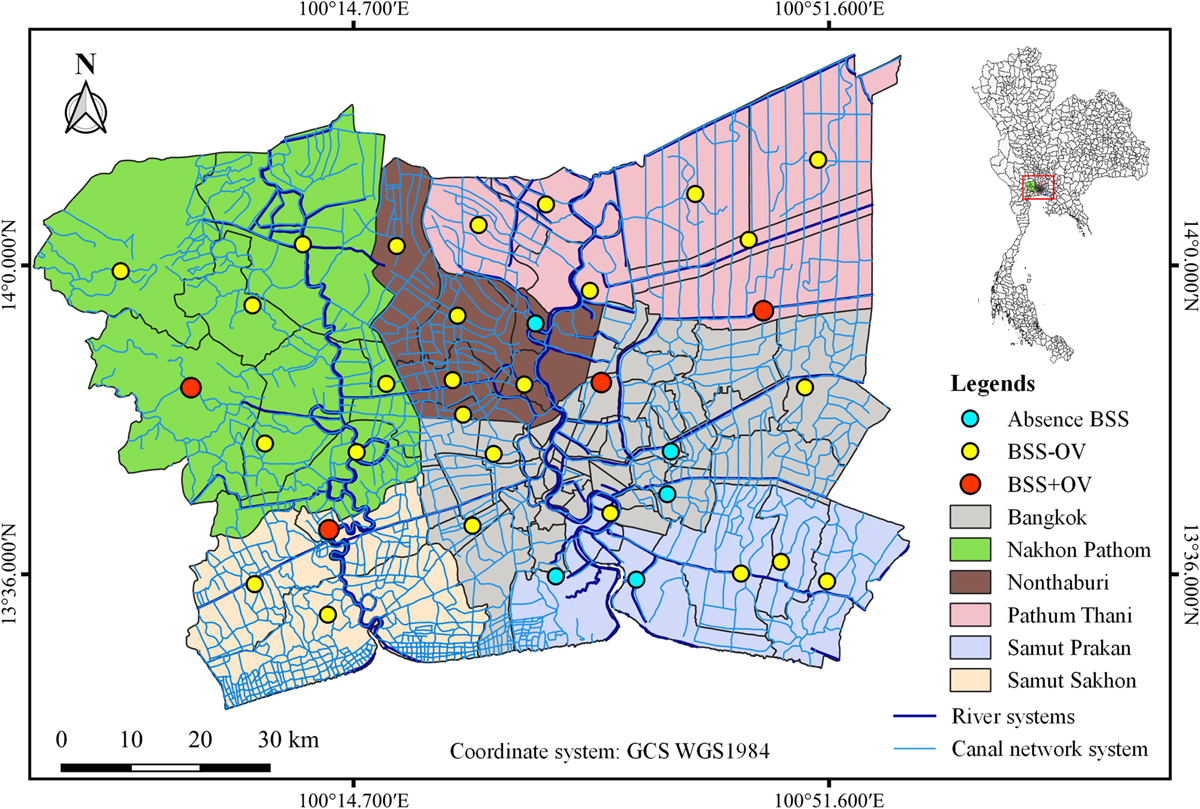
Map of study area in the Bangkok Metropolitan Region, Thailand. Sky blue spot, yellow spot, and red spot represent: (1) sampling locality without distribution of Bithynia siamensis siamensis snails, (2) sampling locality with B. s. siamensis distribution but no detected Opisthorchis viverrini s.l., and (3) locality with B. s. siamensis distribution and detected O. viverrini s.l., respectively.
Current usage metrics show cumulative count of Article Views (full-text article views including HTML views, PDF and ePub downloads, according to the available data) and Abstracts Views on Vision4Press platform.
Data correspond to usage on the plateform after 2015. The current usage metrics is available 48-96 hours after online publication and is updated daily on week days.
Initial download of the metrics may take a while.